Reality check: Only BC’s very richest paying higher tax rate
Under personal tax changes announced by the BC government over the past year and a half—including elimination of Medical Services Plan (MSP) premiums—the vast majority of households are seeing their tax bills fall, while the richest 1% are paying more.
This is good news for tax fairness in BC.
In a fair system, we pay taxes based on our ability to contribute—the higher your income, the higher your tax rate. Changes made by the provincial government between 2000 and 2016 disproportionately benefited the richest few, making BC’s tax system much less fair (and contributing to extreme income inequality to boot).
Of course, taxes are only part of the story. The investments in high-quality, universal public services that taxes help pay for are equally important. But provincial government spending compared to the size of our total economy has plummeted over the last two decades, in part due to successive rounds of tax cuts.
Making further improvements to tax fairness would generate new revenues that could be used to scale up the government’s recent investments in areas like childcare, affordable housing, climate action, poverty reduction and health care. In fact, if BC dedicated the same share of our economy (GDP) to public spending today as we did in 2000, we’d have over $7 billion more at hand annually to invest in these areas.
Making sense of household taxes: how we crunched the numbers
To understand the effect of recent changes, we examined total provincial taxes paid by households at different income levels—including income tax, PST, MSP, tobacco and the carbon tax. This total as a share of household income is called the “effective tax rate.”
We compared effective tax rates in 2016 (the last full calendar year under the previous government) to the planned rates in 2020 (when full elimination of the MSP kicks in).
This analysis was based on information from Statistics Canada that captures what people actually pay in taxes after deductions and credits—specifically, the Social Policy Simulation Database and Model (SPSD/M). (For more details, check out the technical appendix.)
We do not look at property taxes due to limitations of the Statistics Canada model.1 Excluding property taxes means we underestimate the positive impact of recent changes on tax fairness. That’s because the provincial government’s property tax measures are an equalizing force in terms of wealth, narrowly targeting 1–2% of the wealthiest property owners.2
Since the SPSD/M models personal taxes, corporate tax changes are also excluded from our analysis (but potential implications of the new Employer Health Tax are discussed below). We have also excluded the new BC Child Opportunity Benefit announced in last month’s provincial budget, which will come into effect in October 2020 (and will particularly benefit low- and middle-income households).
In our analysis, we divide BC households into 10 groups—called deciles—from the poorest to the richest 10 per cent (based on their total income, which includes employment income, investment income and government benefits like workers’ compensation and income assistance). We also break down the top decile so we can take a look at what’s happening for the very richest 1% and those just below them on the income scale.
Middle and modest income households benefit, top 1% pay more
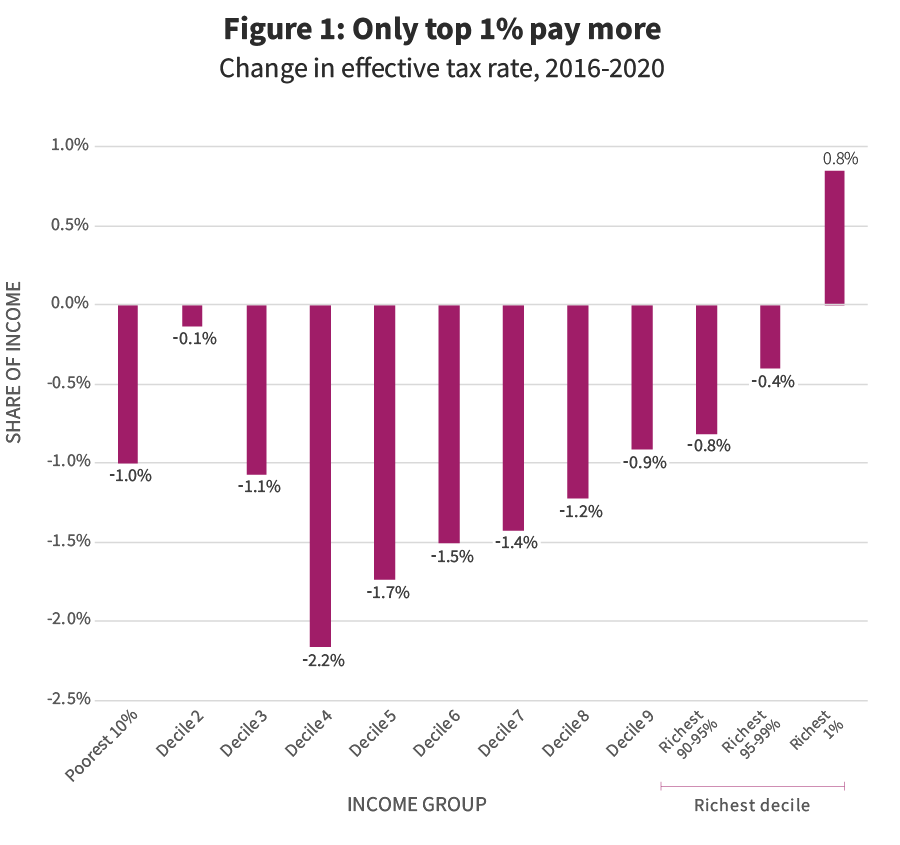
Our analysis finds that the vast majority of households will pay a smaller portion of their income in taxes in 2020 because of the personal tax changes announced by the BC government since taking office. Modest- and middle-income households benefit most from the changes, while only the richest 1% pay more (see Figure 1).
For the bottom 90% of households, provincial taxes fall from an average of 9.1% of income in 2016 to 7.9% in 2020. In contrast, for the most affluent 1% of households, the effective tax rate rises over the same period from 9.6% to 10.5%.
Note: Results for the poorest 10% should be interpreted with caution. This group’s tax bills are composed almost entirely of commodity taxes (e.g., sales tax, carbon tax, fuel tax, tobacco tax), which are the least precisely modelled parts of the SPSD/M and may be sensitive to changes in the System of National Accounts. See Technical Appendix.
The tax reduction for the vast majority of households is driven almost entirely by the elimination of MSP premiums. MSP is a very unfair tax because whether you make $45,000 or $450,000, you pay the same flat dollar amount (though those with very low incomes get assistance). The rich pay a much smaller share of their income in MSP than modest- and middle-income earners.
The top 1% of households also benefit from the elimination of MSP, but this is more than offset by a new tax bracket of 16.8% on income over $150,000.
Other tax changes include annual increases in the carbon tax (along with enhancements to the low-income climate credit) and a smattering of other smaller tax credit changes.
Strikingly, the benefits of the new government’s tax changes are distributed in almost precisely the opposite way as the tax changes under the previous government. The changes between 2016 and 2020 are set to benefit those at the middle and lower end of income distribution most, while requiring the top 1% to pay more. In contrast, the tax changes between 2000 and 2016 most notably benefited the top 1% and benefited modest- and middle-income households least.3 This can be seen in the way that Figure 2 is almost a mirror image of Figure 1.

Note: Results for the poorest 10% should be interpreted with caution. This group’s tax bills are composed almost entirely of commodity taxes (e.g., sales tax, carbon tax, fuel tax, tobacco tax), which are the least precisely modelled parts of the SPSD/M and may be sensitive to changes in the System of National Accounts. See Technical Appendix.
What about those whose MSP premiums were covered by their employer?
Roughly 40% of British Columbians have MSP covered by an employer, according to the best available estimates.4 For this group, the elimination of MSP premiums will not generally translate into immediate pocketbook savings even though it constitutes a cut in their total provincial tax bill.5 But these people will still benefit from never having to pay MSP premiums again including when their employment situation changes.6
The introduction of the Employer Health Tax (EHT) adds further questions. The EHT is a tax on employers not a personal tax, which puts it outside the scope of our analysis.7 However, it is generally expected that, over time, large businesses will try to pass on their EHT bill to employees in the form of slower increases in wages and other benefits8 (small businesses and non-profits are largely exempt from the EHT9). To what extent this pass-through effect will materialize is uncertain and there are some practical constraints on the ability of large employers to do this.10
The upshot of these caveats is that Figure 1 above represents an upper estimate of the size of the 2016-2020 savings from tax changes, since it assigns the full savings from elimination of MSP premiums to households. But the share of the gains shown flowing to modest income households may actually be greater since we expect that employers in lower-wage sectors are less likely to cover their employees’ MSP premiums.11
Big picture: how fair is BC’s tax system?
On the whole, the tax changes under the new government make BC’s personal tax system more fair, after a period of handing the biggest tax cuts to those at the top under the previous government (starting in 2001).12
Thanks to the new top tax bracket, the effective tax rate paid by the richest British Columbians in 2020 will be distinctly higher than for those at the middle and lower ends of the income ladder. This represents a clear improvement to tax fairness compared to 2016 when the effective tax rate was nearly the same across income groups.
Despite this improvement, by 2020 the richest 1% will still pay a much smaller share of their income in personal taxes than they did in 2000—in dollar terms, on average, about $25,000 less annually.
Note: Results for the poorest 10% should be interpreted with caution. This group’s tax bills are composed almost entirely of commodity taxes (e.g., sales tax, carbon tax, fuel tax, tobacco tax), which are the least precisely modelled parts of the SPSD/M and may be sensitive to changes in the System of National Accounts. See Technical Appendix.
Another striking fact is that both the current and previous BC governments instituted large personal tax cuts.13 In fact, for the majority of income earners (the middle 80%), the reduction in the personal effective tax rate appears to be larger under the current government (during the period 2016-2020) than under the previous government (2000 to 2016).14
There are crucial differences, however, between the tax cuts brought in by each government.
First, as discussed, the most recent MSP-driven reduction benefits low- and modest-income households more than those at the top.
Second, forgone revenue from elimination of the MSP is largely replaced by new revenue from a mix of other tax measures on business and the affluent. These changes include the Employer Health Tax, an increase to the corporate income tax rate from 11% to 12% (though the small business rate was cut from 2.5% to 2%), the new top personal income tax bracket and new taxes on wealthy property owners.
Replacing this revenue has helped the current government make important new social investments in areas like child care and housing (which in turn reduce the pressure on household budgets, another improvement not captured in the figures above).
Still, two decades of successive tax cuts have eroded BC’s ability to generate revenues and fund public services (or fiscal capacity).15 As noted earlier, provincial government spending has declined dramatically as a share of our total economic pie (GDP) over the past two decades (see Figure 4). The current government’s tax changes and investments in public programs have stopped/ended this trend, but not reversed it. Strikingly, if we dedicated the same share of our economy to public spending today as we did in 2000, the $7 billion more available each year could be invested in urgent social and environmental priorities.16 In concrete terms, the government could quadruple funding to the CleanBC climate plan, add 10,000 units of new affordable housing per year, raise welfare rates to 100% of the poverty line, fully implement universal $10-per-day childcare and eliminate tuition fees for domestic students—with room to spare.

Source: Ministry of Finance. BC Financial and Economic Review and Budget 2019.
To make major new social and environmental investments possible, BC’s fiscal capacity should not only be maintained, but enhanced. Fortunately, there are many opportunities to further improve tax fairness in BC while also shoring up our province’s capacity to help households through public investment.
For example, we have recommended an additional top income tax bracket of 22% on incomes above $200,000. There is room for additional progressive tax measures on the enormous windfalls of property wealth in BC. For example, when huge increases in private land wealth are created through major new public investments like building the Broadway subway in Vancouver, this wealth should be captured for the public good instead of flowing to private landowners who happen to own property in close proximity to where new stations are built. The Province should explore the best ways to capture this land lift, which is created collectively by all of us through our tax dollars.
Province-wide, property wealth has grown by more than $1 trillion since 2007 and these windfalls are flowing overwhelmingly to the wealthiest households. The Speculation and Vacancy Tax and School Tax on properties over $3 million are important steps to address this and raise revenue for public investment, but they remain modest relative to the huge scale of land wealth increases in BC.
BC is a low-tax province with much room to raise additional revenue. So much so that even notorious fiscal hawks like international bond rating agencies acknowledge this. For example, in its most recent assessment after last year’s BC budget, DBRS commented that BC “has a relatively lower tax burden when compared with most other provinces, which provides the government with flexibility to raise revenue to address budget pressures should they emerge.” Moody’s assessment said much the same.
As we welcome recent improvements to tax fairness in BC, it’s important to remember that income and wealth inequality have reached dizzying heights in our province and growing social and environmental crises demand action. Further improvements to tax fairness should harness our economic capacity to make large new investments in affordable homes and child care for all, climate action commensurate with the crisis, public education, health care and lifting people out of poverty.
Read the technical appendix.
Notes
[1] The SPSD/M does not allow changes to the property tax system to be modelled. It also suffers from data limitations with respect to property tax even prior to the major changes announced.
[2] For more on this point, see our recent analyses of the extreme inequality of property wealth in BC, and evaluation of recent property tax changes, including the Speculation and Vacancy Tax and the additional School Tax on the portion of property value above $3 million.
[3] The bottom decile also had one of the larger percentage decreases in taxes, though this is as a share of their very low incomes. As result, in dollar terms the benefits were very small. Perhaps more importantly, they came in conjunction with chronic underfunding of public investments crucial to those on low incomes. Results for the poorest 10% should be interpreted with caution. This group’s tax bills are composed almost entirely of commodity taxes (e.g., sales tax, carbon tax, fuel tax, tobacco tax), which are the least precisely modelled parts of the SPSD/M and may be sensitive to changes in the System of National Accounts. See Technical Appendix.
[4] There aren’t systematic data on MSP employer coverage. The 40% estimate comes from freedom of information requests discussed in previous research by the CCPA on MSP premiums. The SPSD/M can’t distinguish between those who pay MSP premiums directly and those who have them paid by their employers.
[5] However, some in this group may be expected to negotiate wage or other benefit increases from their employer when MSP premiums are eliminated, particularly if their employer is not subject to the new Employer Health Tax.
[6] If those with current employer coverage could be excluded from the modelling, it would show a smaller magnitude of typical gains from the 2016-2020 tax cuts than seen in Figure 2. At the same time, in terms of the distributional analysis, excluding employer-covered households would likely show an even greater improvement in tax fairness. That’s because we would expect that those in better paying jobs may be more likely to receive employer MSP coverage than those with modest incomes, and thus benefit less from MSP’s elimination.
[7] See our previous analyses of the EHT.
[8] Even if we assume the entire EHT is passed on (which wouldn’t be the case), eliminating MSP premiums ($2.7 billion) and replacing it with EHT ($1.9 billion) still represents a large net tax reduction. The EHT is also much more fairly structured than MSP because it is tied to payroll rather than levied as a flat amount per person.
[9] Employers are exempt from the EHT if their payrolls are less than $500,000 and those with payrolls under $1.5 million pay a reduced rate. Non-profit employers have an even higher threshold and few will pay any EHT.
[10] We would expect large employers to attempt to pass on EHT costs specifically in the form of slower wage increases. But low wage employers will find it difficult to pass on their EHT costs in the context of a steadily increasing minimum wage. More broadly, the extent of how the EHT is paid will depend on the balance of power between workers and employers in a given firm. Compared to other payroll taxes, the case of the EHT is especially complex to model because of the simultaneous elimination of MSP premiums and the various exemptions to the EHT. Employers will fall into at least four categories, some of which will enjoy savings if they previously covered MSP premiums while those that didn’t provide MSP coverage won’t realize those savings. Some employers in each of these groups will pay the new EHT while others will be exempted or pay a reduced rate. Some municipalities, like Vancouver, will pay more in EHT than they paid in MSP coverage and are covering the additional cost through a small property tax increase amounting to roughly $25 for the median property owner. Given the extremely unequal ownership of property wealth in BC, this itself represents a small improvement to tax fairness in wealth terms.
[11] The lowest income workers should also be shielded from employer attempts to pass on EHT costs as the minimum wage rises.
[12] We documented this erosion of tax fairness in an analysis in 2017. In the previous analysis, the 2016 effective tax rates are somewhat different than those shown here, reflecting recent updates to the SPSD/M.
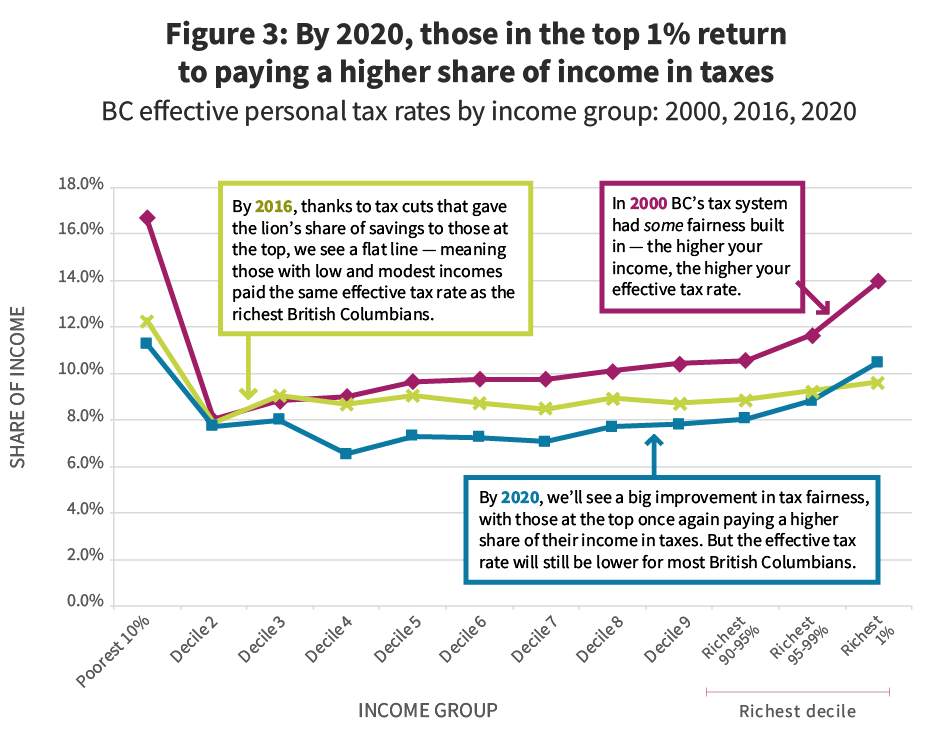
[13] As seen in Figure 3, the line representing effective tax rates for 2016 demonstrates a clear shift downward compared to 2000. In turn, the line for 2020 shifts even further downward with the exception of the final point corresponding to the top 1% income group.
[14] This is unsurprising given the central role of MSP premiums (both their long-running increase from 2000-2016 and then their rapid elimination by 2020) and the fact that MSP is a flat per-person tax borne most heavily by the broad middle of the income distribution. Due to the complexities discussed above, however, precise comparisons of the size of the cuts should be approached with some caution.
[15] Personal tax cuts are only one of the causes of declining revenue as a share of GDP. A major decline in natural resource revenues is another reason.
[16] The budget was in surplus in 2000 as it is today so this is not an artifact of deficit spending.
Topics: Economy, Features, Provincial budget & finance, Taxes