Tax cuts disproportionately benefitted the richest 1% of British Columbians, write @IglikaIvanova & @1alexhemingway: https://t.co/iZbcztdPem pic.twitter.com/BavNnT2WWp
— The CCPA–BC (@CCPA_BC) February 16, 2017
As we wait to hear more about the tax cuts coming in BC Budget 2017, it is important to remember what has happened to our provincial tax system over the past 16 years. Significant tax cuts to personal income taxes between 2001 and 2008, combined with increases to regressive taxes like MSP premiums have reshaped our tax system to favour the top one per cent of households at the expense of middle- and modest-income British Columbians.
So today we have a tax system that is much less fair with marked shifts in how we pay for public services and programs away from upper income households to middle- and modest-income ones, and from progressive taxes like income taxes to regressive taxes and user fees that hit lower-income households harder.
It is a fundamental principle of tax fairness that those who make more should pay more, not only in dollars but also as a share of their income. This is true for BC’s income tax, which is designed to charge higher rates in higher income brackets. But most other BC taxes are not structured that way.
In practice, taxes that charge everyone the same dollar amount (such as MSP) or the same percentage amount on a purchase (such as sales taxes) end up costing higher-income families a smaller share of their income than lower-income families. These are known as regressive taxes to distinguish them from progressive taxes, which are based on the principle of ability to pay.
Looking at the sum of all taxes paid by households (including income tax, PST, MSP, fuel, tobacco, property taxes and the carbon tax), regressive taxes made up 65 per cent of the total in 2016 compared to 56 per cent in 2000. In contrast, income tax—BC’s fairest tax—has fallen from 44 per cent of all personal taxes in 2000 to 35 per cent today (see Figure 1).
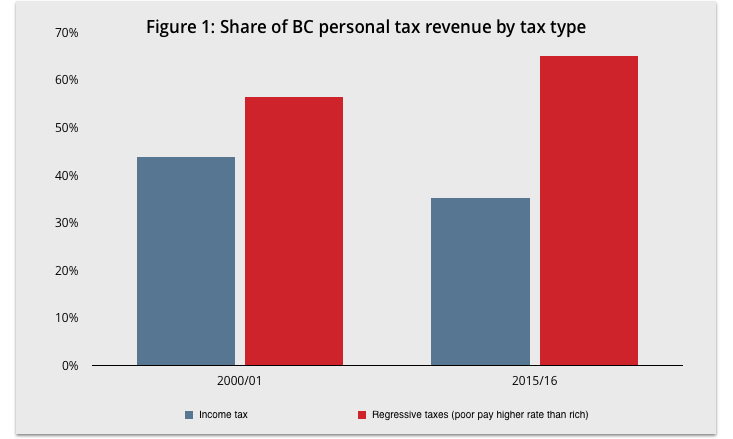
Data from BC Fiscal and Economic Review 2016, Table A2.5.
To get a better picture of how BC’s tax shifts have affected households, we examined the total provincial taxes households at different income levels pay as a share of their household income. The analysis was done using Statistics Canada’s Social Policy Simulation Database and Model (SPSD/M), a database that captures what people actually pay after tax deductions and credits (“effective” tax rates). For more details, check out the Technical Appendix.
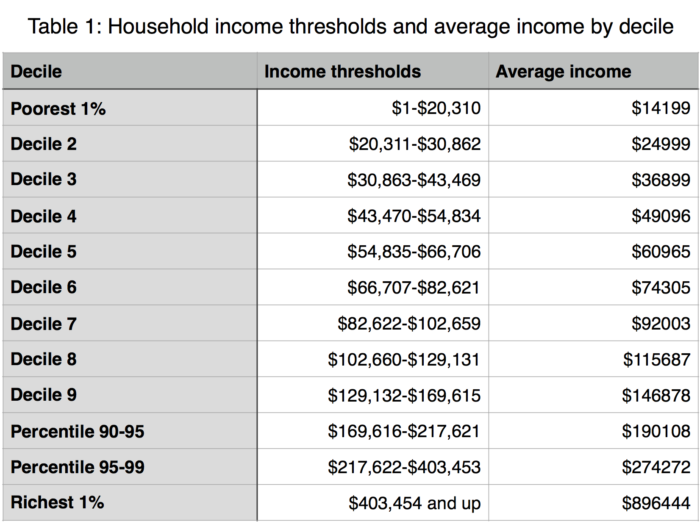
We rank BC households according to their total income, including employment income, other market income (rent, investments) and government benefits like workers’ compensation and income assistance, and divide them into 10 groups of equal size—deciles—from the poorest 10 per cent to the richest 10 per cent. The table below shows the income thresholds for each decile as well as the average income of households in each decile.
We found that the effective tax rate paid by the upper income British Columbians has fallen sharply over the last 16 years, especially for those at the very top (Figure 2).

Figure 2 shows the poorest 10% of households paying the highest tax rates of all income groups but this result should be interpreted with caution. Some of the families in the bottom 10% are more likely to borrow in order to cover their bills, thus having expenditures higher than their incomes (and thus paying sales taxes on more than their incomes). Plus, some families in the bottom 10% have low declared incomes because of capital losses (in investments or small business) while actually having higher disposable incomes and thus are not truly poor.
Our analysis shows that in 2000, households in higher income groups paid slightly more as a share of their income in tax than lower income households with the exception of the richest one per cent who paid a lot higher share of their income in tax than everyone else. However, in 2016 BC’s richest one per cent no longer pay a higher share of their income in taxes than most British Columbians. In fact, the richest one percent—households with income over $403,000—pay a lower effective tax rate on average than the bottom 90 per cent (11.2 per cent compared to an average rate of 11.9 per cent for the bottom 90 per cent).
Why are richer households paying so much less tax than in 2000 while those in the bottom half of the income ladder pay virtually the same as they did before? The income tax cuts of the early 2000s were touted as a policy benefitting all British Columbians. In fact, however, the benefits were skewed to top earners. Any savings going to middle-income earners were offset by sharp increases in regressive taxes like MSP (which has more than doubled since 2000), property tax and carbon tax.
The upshot is the erosion—and inversion—of the basic principle of tax fairness. Yet, it’s more important than ever to make the tax system fairer so that it can counteract the growing inequality in market incomes.
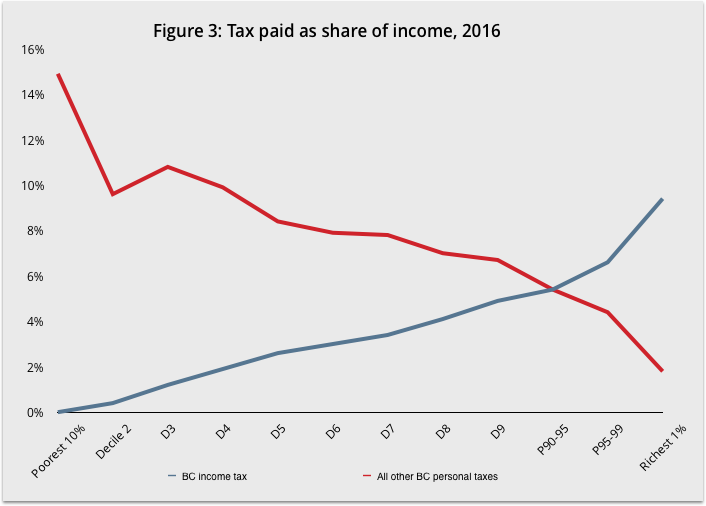
We looked at the effective tax rates BC households pay in income tax and all other personal taxes and found that the vast majority of British Columbians pay a greater share of their income in unfair, regressive taxes than they do in income taxes (see Figure 3). Only the richest 10 per cent pay more in income taxes than they do in other provincial taxes.
Tax giveaway for the 1%; eroded services for all
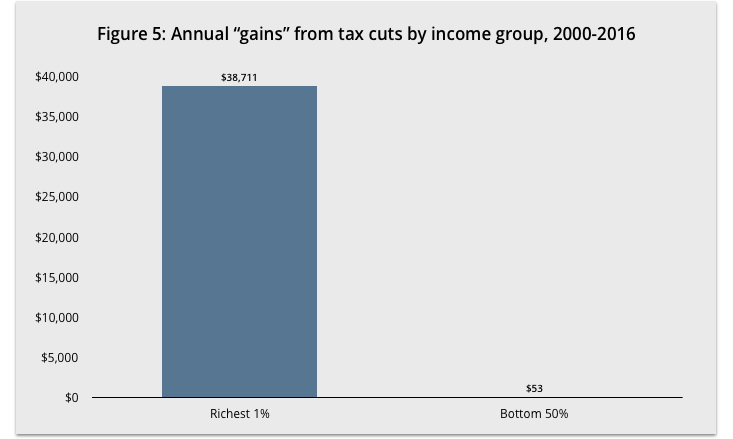
Taken together, tax changes since 2000 have disproportionately benefited the richest British Columbians, who have saved more both in dollar terms and as a share of their income (see Figures 4 and 5). Households with income over $400,000—the richest one per cent—won big with a tax cut of $39,000 per year on average (or 4.3 per cent of their income), compared to what they would have paid with 2000 effective tax rates.
Households making less than $67,000 per year—those in the bottom 50 per cent—saved an average of just $53 from their tax reduction once all taxes including income, sales, MSP, fuel, carbon and property taxes are added up (or 0.1% of their income on average). Hundreds of thousands of lower-income families with household incomes between $20,000 and $43,500 have actually seen their taxes increase since 2000.

This enormous tax cut for the richest British Columbians is exactly the opposite of what British Columbians believe the government should be doing: 88 per cent are in favour of income tax increases for those who make over $250,000 according to a recent CCPA poll (to be released shortly).
To make matters worse, lower- and modest-income British Columbians have been hit with a double whammy. Not only did they see little or no savings from BC’s tax cuts, they are also being squeezed by the growing affordability crises in housing, child care, post-secondary education, and home and residential care for seniors. BC’s tax giveaway to the rich, and tax cuts across the top half of the income distribution, undermined provincial revenues and resulted in a shortfall of public investment in much-needed services and programs, a major driver of these affordability crises.
And that’s aside from other rising costs for average families such as BC Hydro, ICBC and BC Ferries rate increases, which further pressure family budgets.
For most households these increased costs have more than erased any modest gains from provincial tax cuts. If the forgone revenue from these tax cuts were invested instead in $10/day child care, affordable housing, seniors’ care and lower tuition fees, most families would have seen substantial improvements in their quality of life.
The current under-investment in BC’s public services erodes affordability, perpetuates inequality and poverty, puts our environment at risk, and ultimately damages people’s lives. But it doesn’t have to be this way. We can restore fairness to the tax system, ensure the wealthy and powerful pay their share, and pool our resources to meet the collective challenges we face and make our lives better.
Topics: Economy, Features, Provincial budget & finance, Taxes