Eight charts that show highly unequal impact of COVID-19 on BC workers

The COVID-19 crisis has caused unprecedented job losses across Canada and BC has not been spared. Between February and May nearly 590,000 BC workers lost their jobs or the majority of their hours—23 per cent of all workers employed in February—with that number reaching its peak of 645,000 in April.
Despite a slight recovery of jobs in May, Statistics Canada estimates that a staggering one third of BC’s workforce (34 per cent) remains underutilized, which is roughly the same as the Canadian average. The scale of the job losses and disruptions far exceed those seen in typical recessions.
While all sectors of the economy have been affected by the pandemic, the labour market hit has not been equally shared—worsening existing inequalities.
Lower-paid workers in part-time, temporary and more precarious jobs were much more likely to lose their jobs or the majority of their hours than those in higher-paid, more secure jobs. Younger workers, recent immigrants, women — particularly mothers of younger children — and workers who lack the protection of a union were hardest hit.
Why it matters
Understanding the highly unequal impacts of the current crisis on BC workers is crucial for designing effective and equitable solutions as we look to rebuild the provincial economy. Public investments in the recovery must promote job creation in sectors and positions that employ the types of workers who suffered the worst labour market impacts of the pandemic. This will require significant new investments in programs that enable all British Columbians to fully participate in the economy by expanding access to affordable, safe child care and seniors care, and by enabling unemployed and underemployed workers to access low-cost skill development opportunities.
The following eight charts show just how unequal the jobs impacts of the pandemic have been in BC.
1. Low wage workers were significantly more likely to lose their jobs or the majority of their hours compared to those at the top
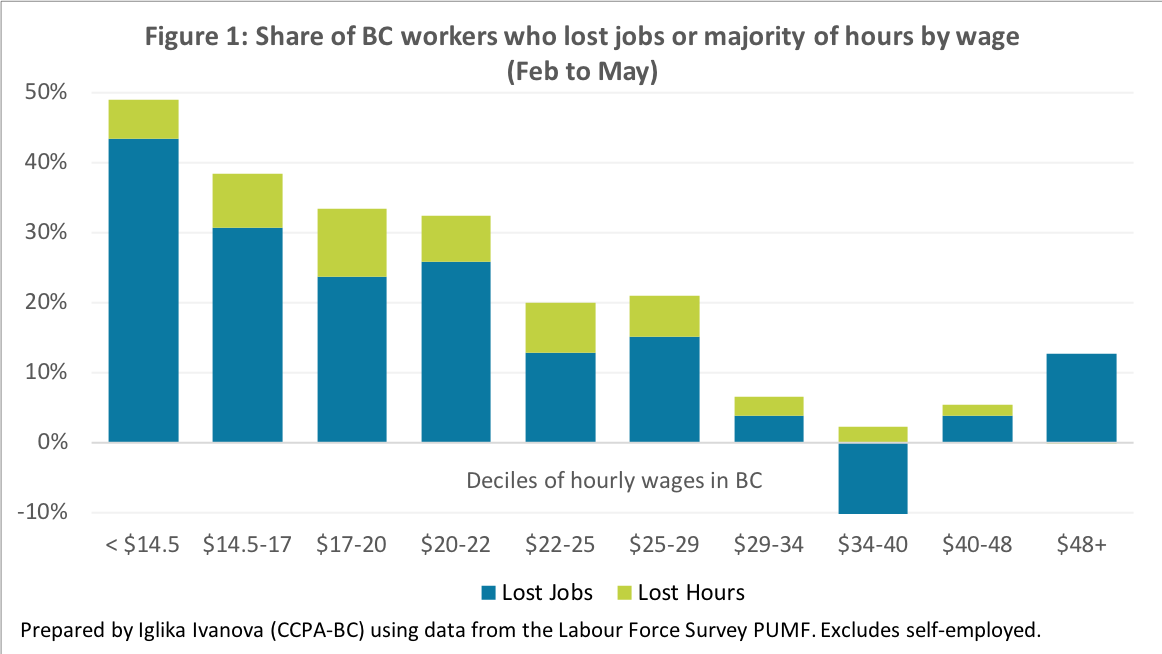
The job losses and cuts in hours resulting from the pandemic have been felt across the income ladder, from the lowest-paid 10 percent of workers (or decile) to the highest paid 10 per cent. However, they have been far more severe for lower-wage workers. Half of BC workers who earned minimum wage or slightly above (the bottom wage decile) lost their jobs or hours compared to fewer than 1 in 10 among higher-paid workers ($29 to $48 per hour).
Half of all BC’s job losses were concentrated in the lowest-paid two deciles (under $17 per hour) as lower paid workers were more likely to be laid off than to have their hours cut. These workers are disproportionately women, racialized and Indigenous workers and recent immigrants. Only 4 per cent of BC’s total job losses were shouldered by those in the top 40 per cent of the wage distribution (earning over $29 per hour).
The heavy impact on workers at the lower end of the income ladder isn’t surprising given the industries most disrupted by the pandemic. Three quarters of those who lost their jobs between February and May were employed in one of five industries: accommodation and food services, retail, construction, information, culture and recreation and a sector called “other services,” which includes personal services, repair and maintenance, domestic workers (including nannies, cleaners and gardeners) and most charities and non-profits. In addition, 43 per cent of the BC workers who lost the majority of their hours between February and May worked in one of these 5 industries.
2. Non-unionized workers were much harder-hit

More than a quarter of non-unionized workers lost their jobs or the majority of their hours compared to only 8 per cent of unionized workers. Unionized workers were also much more likely to see reductions in hours than outright job losses. This is hardly surprising since unionization and collective bargaining tends to offer better workplace protections, and the hardest-hit sectors have lower unionization rates. Expanding access to unionization for lower-paid, precarious workers could improve job security and protections to BC’s most vulnerable workers and should be a key plank of the recovery.
3. Young workers and particularly young women saw staggering job losses
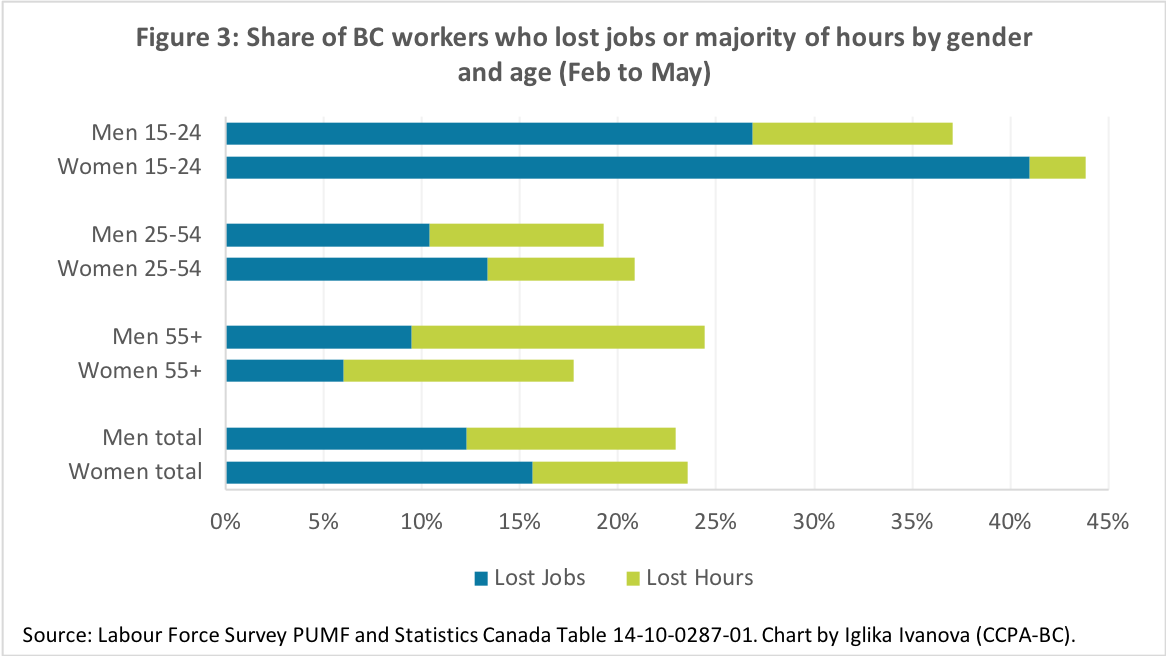
Young workers under 25 in BC were three times as likely as workers aged 25 to 54 to suffer job losses, with one in three young worker jobs (34 per cent) evaporating between February and May.
However, the average job loss among youth hides enormous gender differences. Young women under 25 experienced by far the worst job losses with a 41 per cent drop in employment over February compared to 27 per cent for their male peers. The magnitude of job losses declines significantly after age 25.
The COVID-19 recession has been dubbed a she-cession because women were much more likely than men to lose their job in March, which is unusual compared to previous recessions. While layoffs among men caught up in April, men have seen a faster jobs recovery in May.
In BC, women overall saw a 16 per cent decline in employment between February and May compared to a decline of 12 per cent for men. Further, women were more likely to lose their jobs as a result of the pandemic, whereas men were more likely to have the majority of their hours cut while remaining employed. This difference was particularly pronounced among younger workers.
4. One in three recent immigrants lost their job

Among recent immigrants in BC—those who have had permanent resident status in Canada for less than 10 years—the magnitude of job losses was nearly three times as high as those experienced by more established immigrants and non-immigrants. Immigrant women were more likely to lose their jobs than immigrant men, who were more likely to experience cuts in their hours but keep their jobs.
5. Mothers saw significantly larger job losses than fathers, especially those with young children
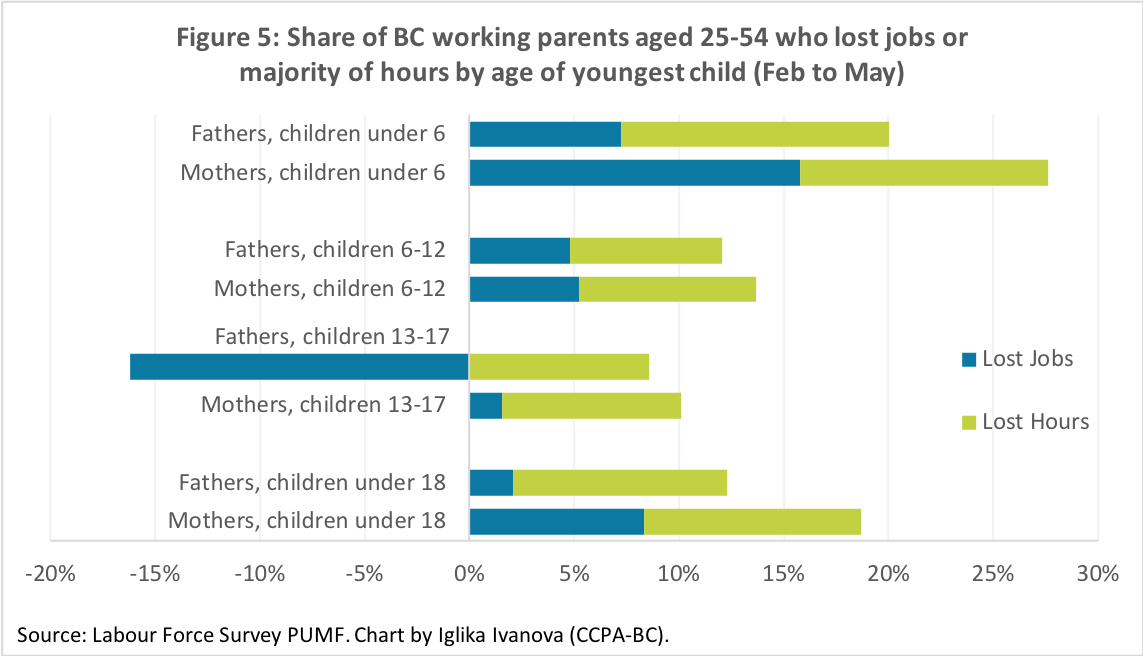
School and child care closures during the pandemic have imposed additional challenges for workers with children. Among working parents aged 25 to 54, those with children under 6 were much more likely to experience losses in jobs and hours than those with older children—mothers in particular. (Working parents make up about 43 per cent of the total BC workforce aged 25 to 54.)
Although the BC government introduced job-protected unpaid leave for parents who need to care for their children while schools and child care providers were closed, a significant share of mothers with children under 6 working in February appear to have lost their jobs (16 per cent).
In addition, parents of younger children were more likely to have lost the majority of their hours than their peers without children, which further suggests that child care and schooling responsibilities are significantly impacting parents’ ability to work and likely their incomes.
Going into the pandemic, women in BC already had a lower workforce participation rate than men and the gap was largest for women with children under 6 due to the lack of access to quality, affordable child care in our province.
Prioritizing safe and accessible child care for working parents over the summer and fall is essential if we are going to rebuild the province’s economy and ensure young families can weather the recession.
6. Single parents with young children even harder hit
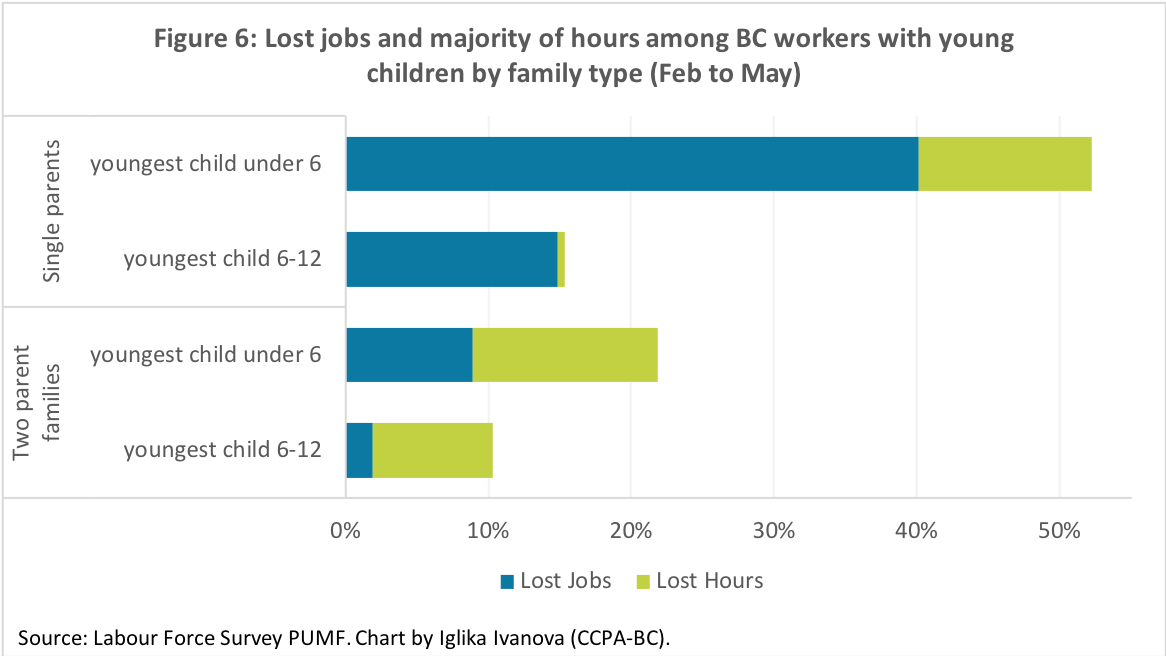
Half of BC’s working single parents with children under 6 lost their jobs or hours. This group was small to begin with due to lack of affordable child care spaces. Not surprisingly, single parents were much more likely to experience job losses than those in two-parent families where child care responsibilities can be shared.
Children in single parent families are already at much higher risk of poverty than their peers in two-parent families, and the gap is likely to grow unless BC makes significant investments in expanding access to safe, affordable child care. Even if most of BC’s unemployed single parents are receiving CERB for now, it is not at all clear that they will qualify for employment insurance once CERB is phased out in the fall and even if they do, their benefits may be too low to keep them out of poverty.
7. Workers in small businesses were more likely to lose their jobs than those in larger businesses
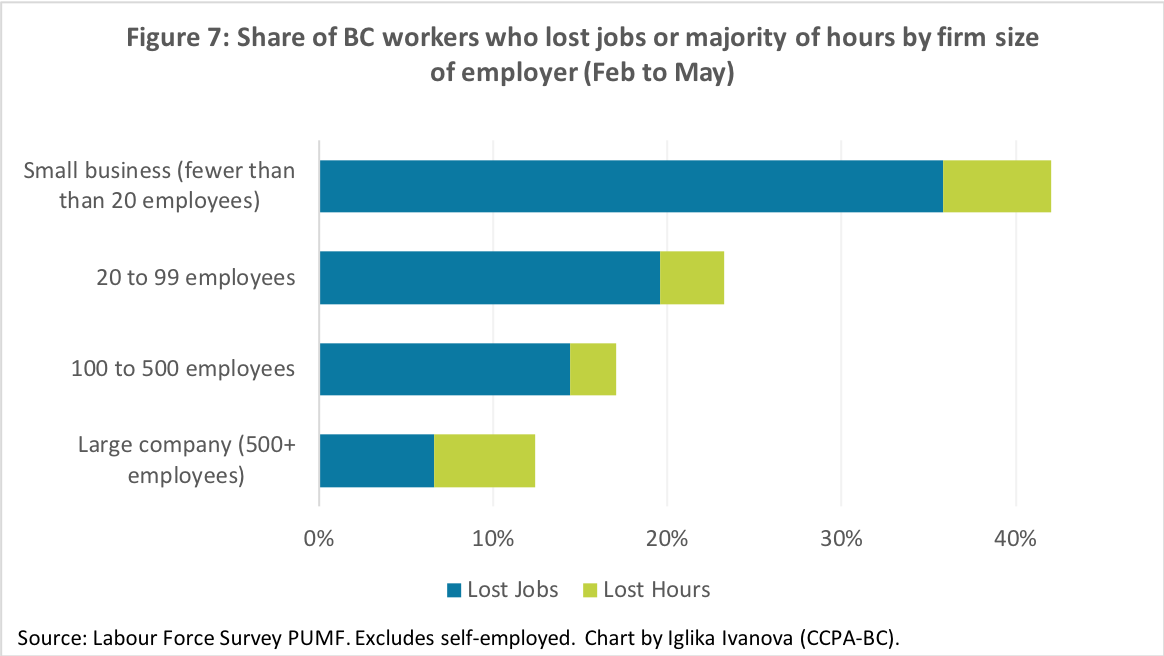
Nearly half of all BC job losses between February and May were concentrated among those working for small employers (fewer than 20 staff)—even though only 1 in 5 BC workers was employed by a small business in February.
This is hardly surprising: small businesses and non-profit employers are less likely to have operational reserves to absorb the costs of pandemic closures or slowdowns—even with available wage subsidies—and have been forced to lay off more of their workers than large corporations.
Not included in the chart above are self-employed workers. About half of BC’s self-employed workers are unincorporated with no employees and this group reported very high losses in hours, with more than 1 in 3 losing the majority of their hours. It is critically important to continue monitoring the jobs recovery for this particularly vulnerable group of workers as the CERB is phased out because they will not qualify for existing employment insurance programs.
8. Indigenous men more likely to have lost their jobs than non-Indigenous workers

Statistics about job loss among Indigenous workers and regional breakdowns are only available in the form of three-month moving averages (figures for loss of hours are not available). Comparing the average employment numbers for March, April and May with those from December, January and February can help us pinpoint which groups and regions were hit harder by the job market losses, although it understates the impact of the crisis because March jobs numbers only partially capture pandemic-related job losses — so these numbers should be viewed with some caution.
Indigenous workers were slightly more likely to lose their jobs than non-Indigenous workers in BC, particularly Indigenous men. Indigenous and non-Indigenous women in BC appeared to have experienced similar rates of job loss, higher than that of non-Indigenous men. Indigenous workers elsewhere in Canada fared better, recording slightly lower job losses than the non-Indigenous population (10 vs 11 per cent) although similarly to BC, working Indigenous men saw larger job losses than Indigenous women.
Table 1: Indigenous and regional employment statistics, three-month moving averages.
| Workers employed in February 2020 | Workers who’ve lost their jobs February to May* | Share of category that lost job | |
| Indigenous workers | |||
| Indigenous women | 53,000 | 6,700 | 13% |
| Indigenous men | 55,600 | 7,900 | 14% |
| Non-Indigenous women | 1,148,300 | 147,700 | 13% |
| Non-Indigenous men | 1,259,500 | 121,700 | 10% |
| Indigenous workers | 108,600 | 14,500 | 13% |
| Non-Indigenous workers | 2,407,800 | 269,400 | 11% |
| By region | |||
| Mainland/Southwest | 1,655,100 | 225,500 | 14% |
| Northeast | 39,300 | 5,000 | 13% |
| Vancouver Island/Coast | 374,900 | 27,800 | 7% |
| Kootenay | 69,700 | 5,000 | 7% |
| North Coast & Nechako | 39,900 | 2,800 | 7% |
| Cariboo | 75,400 | 4,300 | 6% |
| Thompson/Okanagan | 262,800 | 12,900 | 5% |
| British Columbia total | 2,517,100 | 283,200 | 11% |
| By metropolitan area | |||
| Metro Vancouver | 1,471,000 | 210,500 | 14% |
| Greater Victoria | 201,300 | 22,100 | 11% |
| Abbotsford-Mission | 100,700 | 9,900 | 10% |
| Kelowna | 103,900 | 8,700 | 8% |
| British Columbia total | 2,542,300 | 297,300 | 12% |
* Calculated as the difference between average employment for the group over the 3-month period March, April and May and the 3-month period December, January, February. Note that this underestimates the true job loss of the pandemic because March only partially captured COVID-19 related job losses.
Source: Statistics Canada custom tabulation, 2020 (Indigenous workers) and Tables 14-10-0293-01 and 14-10-0294-02 (regional statistics). Note the data for Indigenous workers and by region is not seasonally adjusted while the data by metropolitan area is (which explains why the BC total job loss there is higher).
Topics: COVID-19, Employment & labour