
How (and how much) doctors are paid: why it matters
How we pay doctors through our public health system is an important issue that receives little public scrutiny, despite the fact that physician compensation represents a significant share of the provincial budget and has been among the fastest-growing health care costs in recent years.
A very useful analysis was conducted by BC’s Auditor General in 2014. He found that British Columbia paid over $3.6 billion to its 10,346 physicians in 2011/12, comprising about nine per cent of the total provincial budget.1 To put this in perspective, that’s about the same amount of public funding allocated to social services and housing combined (9.4 per cent in 2011/12).2
There are two main physician payment models in BC. The majority of physicians receive government payments under the fee-for-service model, essentially working as independent contractors who bill our public insurance plan (the Medical Services Plan or MSP).
Under fee-for-service compensation, physicians bill MSP for each service provided (each has a separate billing code and a rate negotiated between the Ministry of Health and Doctors of BC). According to the Auditor General, in 2011/12 fee-for-service payments totalled $3 billion.3 The fee-for-service funding stream differs from how public funds are allocated for the majority of other health care providers, largely because most are compensated under negotiated collective agreements that provide government with certainty about expenditures over the life of the collective agreement (often 3–4 year terms). But since fee-for-service payments do not have a maximum cap in any fiscal year, this compensation model poses challenges to effective planning and management of public health care spending.
In addition to fee-for-service compensation, the Alternative Payment Program (APP) pays for contracted physician services through sessional and salaried compensation models (also referred to as service contracts). Some physicians who work in hospitals and health authority clinical settings, such as general practitioners in the emergency room, are paid through such contracts. APP paid out $410 million in 2011/12 to physicians.4
More recent data from the Canadian Institute for Health Information shows that fee-for-service payments in BC comprised 79 per cent of total physician payments in 2015/16.5
Physicians are well-compensated—and paid more than five times the average BC worker
Sixteen years ago, the Royal Commission on the Future of Health Care in Canada (known as the Romanow Commission) expressed concern that the rising income of physicians could threaten efforts to contain health care costs.6 The Romanow Commission’s concerns were prescient. In 2013, economists Hugh Grant (University of Winnipeg) and Jeremiah Hurley (McMaster University) found that between 2001 and 2010, net real physician income in Canada increased from $187,134 to $248,113.7 They concluded:
“In the 11 years since the Romanow Commission warned that the income of physicians was threatening to become a significant driver of Canadian health-care costs, doctors in this country proceeded to chalk up some of their most rapid gains in earnings since the implementation of medicare. Since 2000, the gap between what the average physician makes, and what the average fully employed Canadian worker earns, has diverged like never before. … All of this has occurred while physicians have actually provided slightly fewer services to patients.”8
Similarly, a 2011 Canadian Institute for Health Information (CIHI) study found that physician compensation was among the fastest-growing drivers of health care costs over the previous decade (1998-2008). Indeed, physician pay increased by an average 6.8% per year over that period, far outstripping the gains for other workers in health and social services.9 A little more than half of this increase (3.6% per year) was attributed to growth in fee-for-service billing schedules.
In BC, the average physician received $284,918 in gross payments from the provincial government in 2015/16—more than five times the annual employment income of the average full-time worker in BC ($55,776). Payments to the average physician (not necessarily working full-time) were significantly higher than incomes of workers in any other health occupation (with non-physician pay averaging $58,114), including nursing ($71,168) and non-nursing health professions ($74,008).10
Why does this matter?
The above figures do not reflect the overhead costs many physicians must pay (such as for leasing clinic space and paying staff)—an issue discussed in greater detail below. Nevertheless, there is a wide gap between the incomes of physicians, other health care providers and the average BC worker, which contributes to the troubling growth of severe income inequality. Ironically, we know from a large body of evidence that rising inequality is directly connected with poor health among lower-income groups and higher public health care costs (e.g. increased rates of hospitalization and chronic disease), among other societal problems.11 Instead of helping improve health, high physician pay is contributing to the larger problem of inequality.
The earnings gap between physicians: 97 of BC’s top 100 highest-paid physicians are specialists
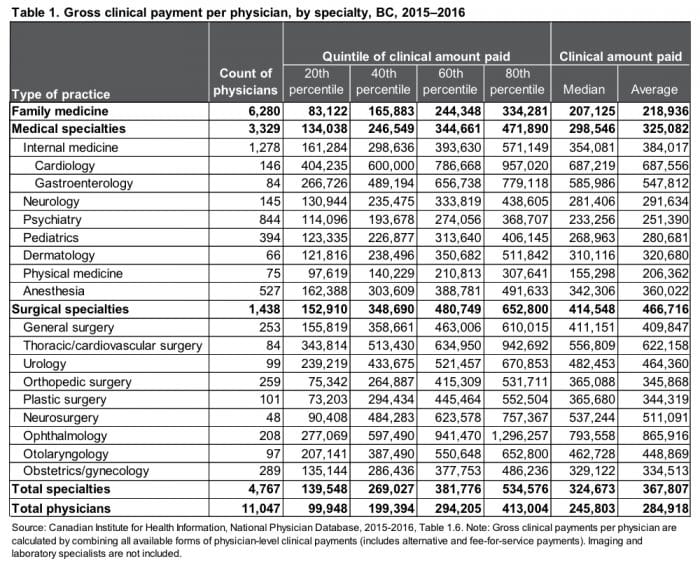
Another important issue is the wide gap in earnings between family physicians and specialists in BC (see Table 1).12 The difference between the average clinical amount paid to a family physician ($218,936) and the average specialist ($367,807) is nearly $150,000. The difference in earnings is greatest between surgeons and family physicians, with the average surgeon earning more than twice the average family physician. In some specialty areas, ophthalmology in particular, the gap in clinical payments is stunning. An ophthalmologist in the 80th percentile will gross nearly $1.3 million per year—more than six times the average family doctor.
The list of the top 100 highest-billing physicians in 2015/16 illustrates this divide.13 Among these practitioners, 97 were specialists, with ophthalmology (62) the leading practice area followed by cardiology (20). MSP payments to the top 100 highest-billing physicians ranged from $1,051,859 to $3,306,401.
What accounts for this gap?
In some specialty areas, such as ophthalmology, advances in techniques have significantly reduced the time required to perform procedures that were once more complex (e.g., the time to perform cataract surgery has been reduced from one hour to 15 minutes). However, the fee-for-service billing schedule has not significantly changed to reflect this reality. As the Auditor General notes, it took six years for the Ministry of Health to get approval from the Medical Services Commission14 to reduce the cataract fee, which was finally done in 2018. Even then, ophthalmologists unsuccessfully tried to block the change by taking the Province to court.15
Figures for the top 100 highest-billing physicians highlight the challenge of containing health care costs under the fee-for-service compensation model, which financially rewards volume-based medicine even though a growing body of evidence has documented that more treatments and surgeries do not always benefit patients and can even cause harm.16
Untangling physician pay
There are several important limitations when interpreting physician payment data from the Canadian Institute for Health Information and the BC Medical Services Plan:
- Many doctors have significant overhead costs, including leasing clinic space and paying office staff. Under our dominant fee-for-service independent contractor model, these costs must come out of gross MSP payments. Put another way, gross payments do not equal a physician’s net income. There is very little high-quality peer-reviewed research on typical overhead expenses. A 2012 study of self-reported overhead for Ontario physicians estimated that overhead ranged from 12.5 to 42.5 per cent.17 However, for some physicians—specialists, in particular—health authorities or academic institutions may cover overhead costs depending on the particular practice setting. That said, even if the average BC ophthalmologist’s overhead were 42.5 per cent of gross earnings, their average earnings would still be much higher than most other specialists and physicians and their net income would still be nearly nine times that of the average full-time worker.18
- Physicians have access to a number of tax loopholes that are not available to most Canadians and that disproportionately benefit high-income earners. Alberta and BC lead the country in physicians’ use of medical practice incorporation through a “Canadian-Controlled Private Corporation” (CCPC). In 1996, 44.2 per cent of BC physicians in private practice were incorporated. By 2011, this had jumped to just over 70 per cent.19 A recent study on the use of CCPCs found that, on average, “incorporated physicians realized a four per cent reduction in personal income taxes and accumulated retained earnings of at least $10,000 annually in their CCPC from 1996 to 2011.”20 The financial benefits of incorporation stem from retained earnings and income splitting. Some positive changes to income splitting last year by the federal government have reduced the amount of tax avoidance possible.
- Third-party billings are another significant income source for physicians, which include WorkSafeBC clients, ICBC clients and services billed to the Armed Forces, Corrections Canada and the federal Refugee Health Program.
- Extra-billing is also not captured in payments from the provincial government. BC has developed an unfortunate reputation due to some physician- and investor-owned clinics charging illegal out-of-pocket fees to patients in exchange for faster access. A 2012 BC government audit found extensive illegal extra-billing and overlapping claims to MSP by Brian Day’s two for-profit clinics (Cambie Surgery Centre and Specialist Referral Clinic). In 2017, a Globe and Mail investigation found “hundreds of examples of extra-billing and double-dipping by BC doctors in provincial audits…” A March 2017 internal government memo, released under Freedom of Information, reveals how pervasive the issue may be. By August 2017, the new BC government announced three private clinic audits in order to investigate suspected violations of the Canada Health Act and prevent the claw back of federal health care funding (for every dollar of extra-billing, the Province loses a dollar in federal funding). The memo states that an additional seven private clinics are awaiting audits for potential extra-billing dating back to 2008. The reason these audits were not conducted is redacted, but internal Ministry of Health resourcing to conduct the audits appears to be at issue.
Time to rethink physician compensation
Notwithstanding the challenges in untangling physician pay, we know that doctors in Canada and BC are well compensated for the important work they do. The University of Toronto’s Gregory Marchildon and Michael Sherar concluded in a recent paper that “Canadian doctors are among the more highly remunerated among the OECD countries for which data are available. Moreover, the growth in remuneration, especially for specialists, is among the very highest in these OECD countries.”21
What is notable about British Columbia is that we lag behind other provinces and jurisdictions in introducing alternative physician compensation models that better support high-quality, cost-effective, team-based care.22
In Scotland, for example, a new contract for general practitioners moves in a promising direction by gradually taking the burden of overhead and ancillary expenses away from doctors and introducing a population-based payment model (called capitation). In time, this approach will allow for much greater clarity between government and the medical association when negotiating compensation. It will seek to eliminate uncertainties and disagreements that arise when negotiating overhead costs, which can vary considerably between physicians and practice location.
In Canada, negotiations between medical associations and provincial governments over compensation have often been fractious. But this is not a reason for provincial governments, the public and physicians themselves to shy away from addressing this important issue. As discussed above, physician pay is a major cost driver in health care. But doctors are also gatekeepers for other health services, which means physician compensation is closely linked to issues of health system governance, accountability, cost-effectiveness and quality.23 That BC’s compensation models do not address these issues was one of the major concerns raised by BC’s Auditor General, who recommended that BC “rebuild physician compensation models so they align with the delivery of high-quality, cost-effective physician services.”24
However, we are making progress in BC. The provincial government has recognized the limitations of fee-for-service physician remuneration and the growing preference of new medical school graduates for alternatives.25 Last May, the BC government announced opportunities for 200 recent family medicine graduates to work under a new compensation model. The success of this initiative will depend in large part on shifting towards evidence-based non-profit primary care models—such as Community Health Centres26—that can provide physicians new opportunities to work with a team of health care providers, including pharmacists, nurse practitioners and social workers.
Modernizing physician compensation will address a widely recognized barrier to integrated and collaborative team-based primary care.27 It will also better align physician compensation with broader health system goals of achieving higher quality and more cost-effective care. This kind of innovation is long overdue and I hope to see more of it in the months and years to come.
———
Read CCPA-BC’s recommendations for priorities and funding for health care in BC’s 2019 budget.
Notes
- Auditor General of British Columbia (2014), Oversight of Physician Services, p. 4.
- BC Ministry of Finance (2018), First Quarterly Report September 2018, p. 59.
- Auditor General of British Columbia (2013), Health Funding Explained, p. 16.
- Auditor General of British Columbia (2013), Health Funding Explained, p. 16.
- Canadian Institute for Health Information, National Physician Database, 2015-2016, Table 1.2.
- Commission on the Future of Health Care in Canada (2002), Building on Values: The Future of Health Care in Canada – Final Report, p, 102.
- Hugh M. Grant and Jeremiah Hurley (2013), Unhealthy Pressure: How Physician Pay Puts the Squeeze on Health-Care Budgets, The School of Public Policy, University of Calgary, p. 11.
- Hugh M. Grant and Jeremiah Hurley (2013), Unhealthy Pressure: How Physician Pay Puts the Squeeze on Health-Care Budgets, The School of Public Policy, University of Calgary, p. 1.
- Canadian Institute for Health Information (2011), Health Care Cost Drivers: The Facts, p. vi.
- Statistics Canada, Table 14-10-0307-01, Employee wages by occupation, annual, retrieved November 24, 2018. 2016 average weekly wage rates are used and assumes 52 weeks of employment income.
- Richard Wilkinson and Kate Pickett (2009), The Spirit Level: Why More Equal Societies Almost Always Do Better. London: Penguin; Michael Marmot (2015), The Health Gap: The Challenge of an Unequal World, New York: Bloomsbury Press; Clare Bambra (2016), Health Divides: Where You Live Can Kill You, Bristol: Policy Press; Danny Dorling (2017), The Equality Effect: Improving Life for Everyone, Oxford: New Internationalist.
- See also: Hugh M. Grant and Jeremiah Hurley (2013), Unhealthy Pressure: How Physician Pay Puts the Squeeze on Health-Care Budgets, The School of Public Policy, University of Calgary, pp. 16-17.
- Author’s analysis of MSP Blue Book, https://catalogue.data.gov.bc.ca/dataset/msp-blue-book, retrieved November 11, 2018. Physician practice specialties were determined by cross-referencing the College of Physician and Surgeons of British Columbia’s Physician Directory available at https://www.cpsbc.ca/physician_search.
- The Medical Services Commission is a statutory committee made up Doctors of BC representatives, government officials, and public members with the responsibility of managing BC’s Medical Services Plan in a cost-effective manner.
- Auditor General of British Columbia (2014), Oversight of Physician Services, p. 30. The 2015/16 MSP billing data do not reflect the reduced cataract surgery fee implemented in 2018.
- Charles J. Wright, G. Keith Chambers, and Yoel Robens-Paradise (2002), Evaluation of indicators for and outcomes of elective surgery, CMAJ 167(5), pp. 461-466; Andrew Longhurst, Marcy Cohen, and Margaret McGregor (2016), Reducing Surgical Wait Times: The Case for Public Innovation and Provincial Leadership, Canadian Centre for Policy Alternatives—BC Office, pp. 17-18. See also Choosing Wisely Canada, https://choosingwiselycanada.org/.
- Jeremy Petch, Irfan A. Dhaka, David A. Henry, Susan E. Schultz, Richard H. Glazier, and Sacha Bhatia (2012), Public payments to physicians in Ontario adjusted for overhead costs, Healthcare Policy 8(2), p. 32.
- Calculated based on average ophthalmologist gross payments ($865,916) minus overhead of 42.5% equals $497,902. Average full-time BC worker earns approximately $55,776 annually.
- Lars Nielsen and Arthur Sweetman (2018), Measuring physicians’ incomes with a focus on Canadian-Controlled Private Corporations, Healthcare Papers 17(4), pp. 80-81.
- Lars Nielsen and Arthur Sweetman (2018), Measuring physicians’ incomes with a focus on Canadian-Controlled Private Corporations, Healthcare Papers 17(4), p. 77.
- Gregory P. Marchildon and Michael Sherar (2018), Doctors and Canadian medicare: Improving accountability and performance, Healthcare Papers 17(4), p. 17.
- Allie Peckham, Julia Ho, and Gregory Marchildon (2018), Policy Innovations in Primary Care Access Across Canada: A Rapid Review Prepared for the Canadian Foundation for Healthcare Improvement, pp. 5-6.
- Gregory P. Marchildon and Michael Sherar (2018), Doctors and Canadian medicare: Improving accountability and performance, Healthcare Papers 17(4).
- Auditor General of British Columbia (2014), Oversight of Physician Services, p. 8.
- Vanessa Brcic, Margaret J. McGregor, Janusz Kaczorowski, Shafik Dharamsi, Serena Verma (2012), Practice and payment preferences of newly practising family physicians in British Columbians, Can Fam Physicians 58: pp. e275-281. See also: Canadian Foundation for Healthcare Improvement (2010), Myth: Most physicians prefer fee-for-service payments.
- Marcy Cohen (2014), How Can We Create a Cost-Effective System of Primary and Community Care Built Around Interdisciplinary Teams? CCPA Submission to the Select Standing Committee on Health, Canadian Centre for Policy Alternatives—BC Office; Rick H. Glazier, Brandon. M. Zagorski, Jennifer Rayner (2012), Comparison of Primary Care Models by Demographics, Case Mix and Emergency Department Use, 2008/09 to 2009/10, Institute for Clinical Evaluative Sciences; Grant M. Russell, Simone Dahrouge, William Hogg, Robert Geneau, Laura Muldoon, Meltem Tuna (2012), Managing Chronic Disease in Ontario Primary Care: The Impact of Organizational Factors, Annals of Family Medicine 4, pp. 309-318.
- Marcy Cohen (2014), How Can We Create a Cost-Effective System of Primary and Community Care Built Around Interdisciplinary Teams? CCPA Submission to the Select Standing Committee on Health, Canadian Centre for Policy Alternatives—BC Office, pp. 14-16.
Topics: Economy, Features, Health care


