
BC’s child poverty rate: Don’t cherry-pick the numbers

It’s always welcome to see poverty identified as an important issue in our elections as it was in last Wednesday’s BC Leaders’ Debate. We want to see our political leaders challenging each other to do better on this file.
However, in the debate—as well as in numerous media interviews—Premier Clark has repeated the claim that BC’s child poverty rate has declined by 50% under her government.
This is only true when one cherry-picks the starting point (base year), and relies on a poverty measure that is so out-of date that one is hard pressed to find an economist who still uses it.
University of BC economist Kevin Milligan produced the following chart for CBC news that helpfully shows how the premier derives her claim.
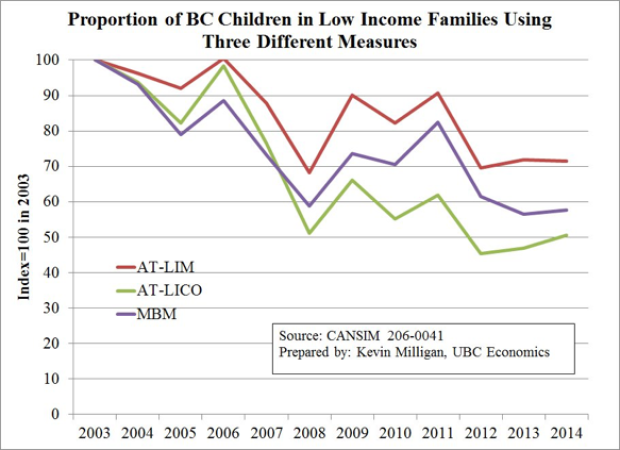
The green line is the LICO statistic Christy Clark chose to use, showing the sharpest drop in child poverty if you measure between 2006 and 2014. (Kevin Milligan/UBC Economics)
As you can see, the Premier’s claim holds true only when using the year 2003 as the starting point, and only when using the Low-Income Cut-Off after tax (LICO-AT).
Let’s dissect these two choices in turn.
First, the base year. Not seen in the above chart is what happened before 2003. Notably, 2003 was a peak year for the poverty rate. During the BC Liberal’s first years in office, between 2001 and 2003, the child poverty rate rose. To demonstrate, we’ve extended Prof. Milligan’s chart back to 2000.
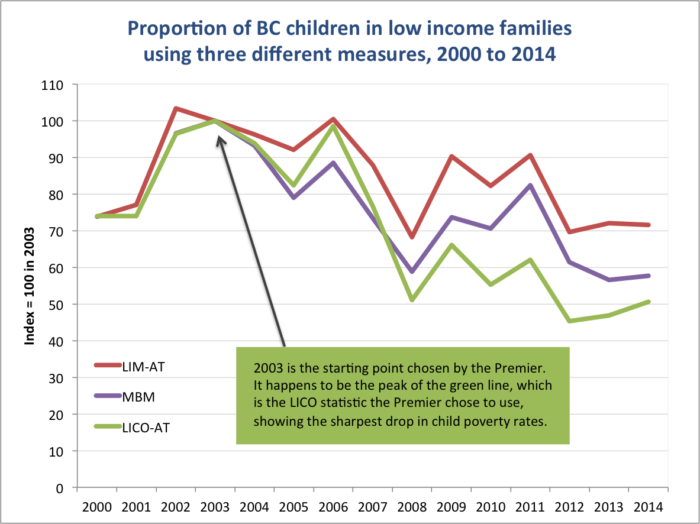
Source: CANSIM 206-0041. Prepared by: Iglika Ivanova, Canadian Centre for Policy Alternatives.
Using the LICO-AT, the BC child poverty rate rose from 14.2% in 2000 to 19.2% in 2003. As of 2014, the last year for which we have data, Statistics Canada finds the LICO-AT BC child poverty rate to be 9.7%. So if we took the year 2000 as our base (the year before the Liberals were elected), the decline would be 32% (not 50%).
Using the Low Income Measure after tax (LIM-AT), the BC child poverty rate was 15.8% in 2000, it rose to 21.4% in 2003, and as of 2014 it fell back down to 15.3%. Meaning, it has barely budged in all that time.
The Market Basket Measure (MBM) only came into use in 2002.
In the above chart, regardless of the measure you look at, the BC child poverty rate in 2014 is virtually unchanged from 2008 (the last year before the recession). Child poverty rose during the recession and declined as the economy recovered – exactly as one would expect. It’s nothing for a government to brag about.
First Call: BC Child and Youth Advocacy Coalition, in their annual BC child poverty report card uses the LIM-AT, drawing on more extensive tax-filer (rather than survey) data. Here’s what the longer-term trend looks like based on that measure.
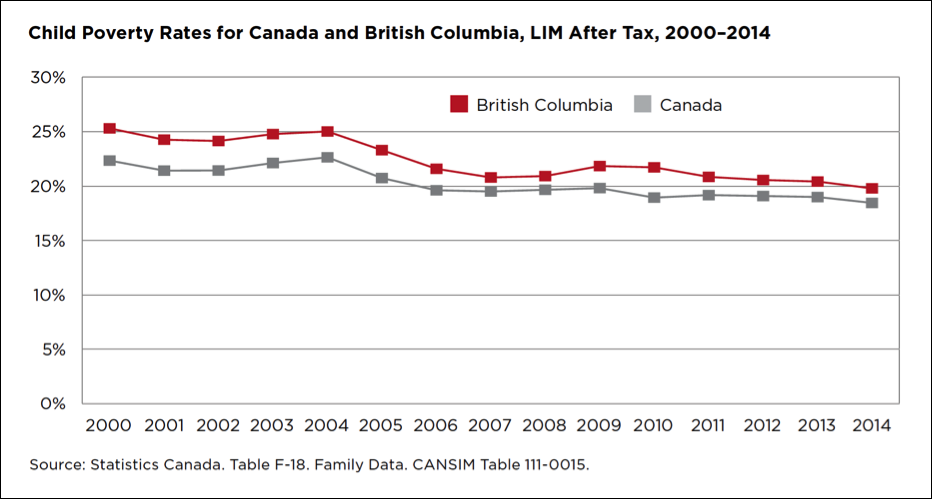
Again, as you can see, hardly a great news story. BC’s child poverty rate measured this way declined by about 20% between 2000 and 2014, and consistently ranks higher than the national rate.
And what of the provincial government’s choice of using the LICO to measure its “success”?
As we explained in our January report Long Overdue: Why BC Needs a Poverty Reduction, there is much debate about different poverty measures. There is no official “poverty line” in Canada. Instead, Statistics Canada produces a number of annual low-income measures – the Low-Income Cut-Off (LICO), the Low-Income Measure (LIM), and the Market Basket Measure (MBM).
For years, the most commonly used measure, and the one treated as the unofficial poverty line by many, was the LICO. However, it is now hugely out-of-date.
The LICO is an income threshold below which a family spends a larger proportion of its income than the average family on the basic necessities of shelter, food, and clothing. But it has not been rebased since 1992, making it an increasingly unreliable metric. Given rising housing costs, and the fact that the costs of other necessities have tended to rise faster than the general CPI, the LICO base is becoming increasingly dated. The LICO is particularly problematic in BC as it fails to capture the higher cost of housing in our province. For this reason, CCPA economists no longer recommend using the LICO, and instead we track poverty rates using the more reliable low-income measure (LIM) and market basket measure (MBM).
At the end of the day, between 122,000 and 124,000 BC children are growing up in poverty in BC, depending on whether you use the MBM or LIM-AT. No matter how you cut it, that’s way too many for a rich province like BC.
Topics: Children & youth, Economy, Election commentary, Poverty, inequality & welfare