A fascinating, and shocking, literature on the incomes at the very top of the distribution has emerged in recent years. Typically, Statistics Canada only reports income distributions for quintiles, or 20% groupings, and occasionally deciles, or 10% groupings. But new research based on tax filing has shown that the real action has been at the very top. The share of income going to the top 1% fell a great deal after World War II and continued to do so up to the late-1970s, but since then the trend has reversed itself and in recent years the income share of the very top is back up to where it was in the 1920s and 1930s.
It does not have to be this way: these trends are prominent for the Anglo countries (US, UK, Canada, Australia and New Zealand) but the trend towards a growing slice of the pie going to the very top has not proven to be the case in countries like Japan, France or Sweden. This corresponds to the shift in political economy of the Anglo countries away from the norms of the post-war decades that saw growing public services and income supports for the poor, with governments that more tightly regulated labour and goods markets, and towards a return to smaller government and more emphasis on markets as the arbiters of social and economic outcomes.
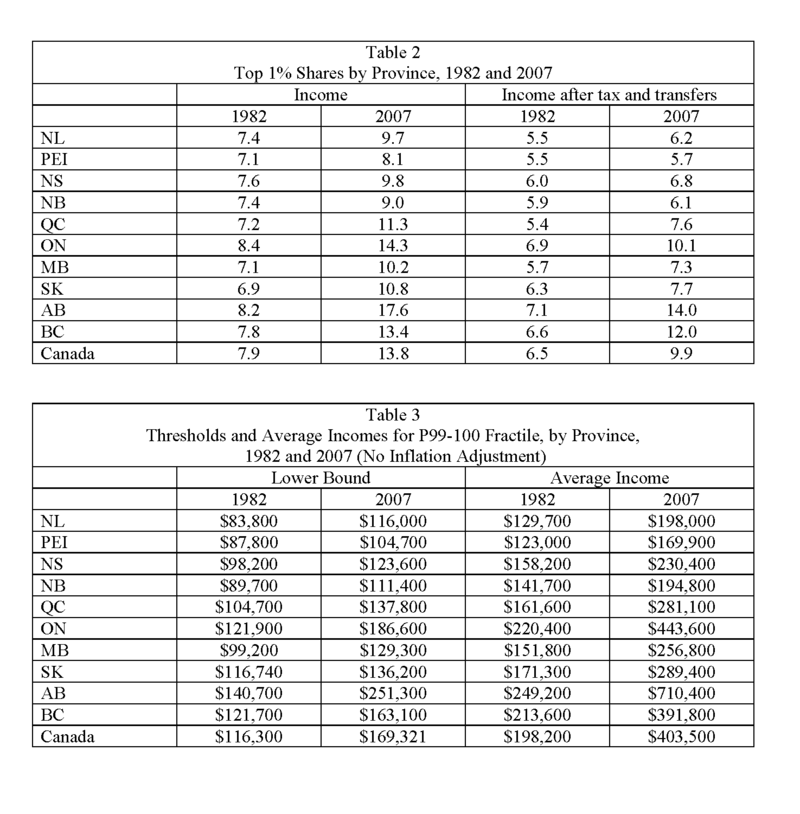
In a recent update of the Canadian data by Mike Veall of McMaster University, for the first time we have provincial data to show how dynamics have played out across in different parts of the country. In BC, for example, the top 1% received 7.8% of income in 1982, and this surged to 13.4% in 2007. After taxes and transfers, the situation is a bit better but not really that much, and the trend is the same: the top 1% received 6.6% of income in 1982, rising to 12.0% in 2007.
BC’s results roughly track the national trend, and it is notable that the top market income share is larger in both Ontario and Alberta, and smaller in every other province. After taxes and transfers, however, Ontario’s top 1% only got a measly 10% of the total income pie, making BC number two in terms of inequality after Alberta. As the Table shows, other provinces do a much better job of keeping top incomes in check.
Note: More info available on Canadian and Anglo top income inequality is available here.


Aldyen Donnelly // Jun 14, 2010 at 11:56 am
Income inequality can only increase in BC over the next few years.
When any government finances income tax rate cuts with new revenues from energy taxes (carbon and/or value-added), that government has shifted tax burden from wealthier households to poorer households, from resource extracting corporate entities to value-adding entities and from the private sector to the public sector.
The relationship between the income to energy consumption tax shift and increased income inequality is well- documented in British, Swedish and German budget documents, as well as the actions these governments have taken to try to mitigate this perverse outcome.
Government agencies, crown corporations and not-for-profits do not pay income taxes. But they do pay carbon taxes and HST. So every nation that has elected to finance cuts in income tax rates (or hold off required increases) by introducing/increasing energy consumption taxes has shifted tax burden from the private sector to the public sector. Of course, this means required increases in payroll taxes, health care premiums, tuition rates, mandatory social security contributions and/or public service cuts, or all of the above. In other words, the income to energy tax shift is unsustainable.
Unfortunately, however, each of these governments reports that they have failed, to date, to curb the trend to increasing income inequality.
I found the picture quite clear when I started reading the annual UK Treasury report entitled “The Effects of Taxation and Benefits on Household Income” (1999 through 2009) at: http://www.statistics.gov.uk/STATBASE/Product.asp?vlnk=10336.
Each annual report includes a graph showing the direct and indirect taxes paid, by household income quintile, where “indirect taxes” are consumption taxes including VAT and carbon taxes. The same graph also shows cash and in-kind transfers to households, also by income quintile.
Table 3 in the dataset downloadable from the above URL shows that VAT eats up 10.8% of the disposable income of the poorest UK families, while it takes only 5.8% of the disposable income of the wealthiest 20%. Taxes on carbon-based fuels and vehicle purchases take 3.2% of poorest household incomes and only 1.6% of wealthy family incomes. In other words, these tax measures are highly regressive, and financing income tax rate cuts with new value-added and energy consumption taxes indisputably shifted tax burden from the rich to the poor in the UK–even after we take into account tax rebates, heating fuel rebates and income support payments to the poor.
Every year, the graph shows that 60% of UK families: (1) pay more in consumption taxes than they pay in income taxes, but (2) need to receive more in annual cash transfers to survive than they pay in consumption taxes.
Notwithstanding the assertion by economic theorists who suggest that a system that taxes and then rebates substantial amounts of cash to the same families in the same year, this is an highly inefficient procedure.
The combined costs of administering tax collection, family income support and tax rebate programmes eats up some 12% to 30% (depending on the nation) of revenues collected from families in the 3 lowest quintiles. Highly inefficient.
And given that income inequality has generally worsened–not improved–since most of these nations have implemented their income to consumption tax shift, the strategy has also proved to be ineffective.