One of the first things I did after the HST referendum results came out today was look at how different electoral districts voted. I noticed that West Vancouver, North Vancouver and Point Grey had the highest number of “No” votes (to keep the HST) while Surrey and East Van districts had the highest number of “Yes” votes (to scrap the HST).
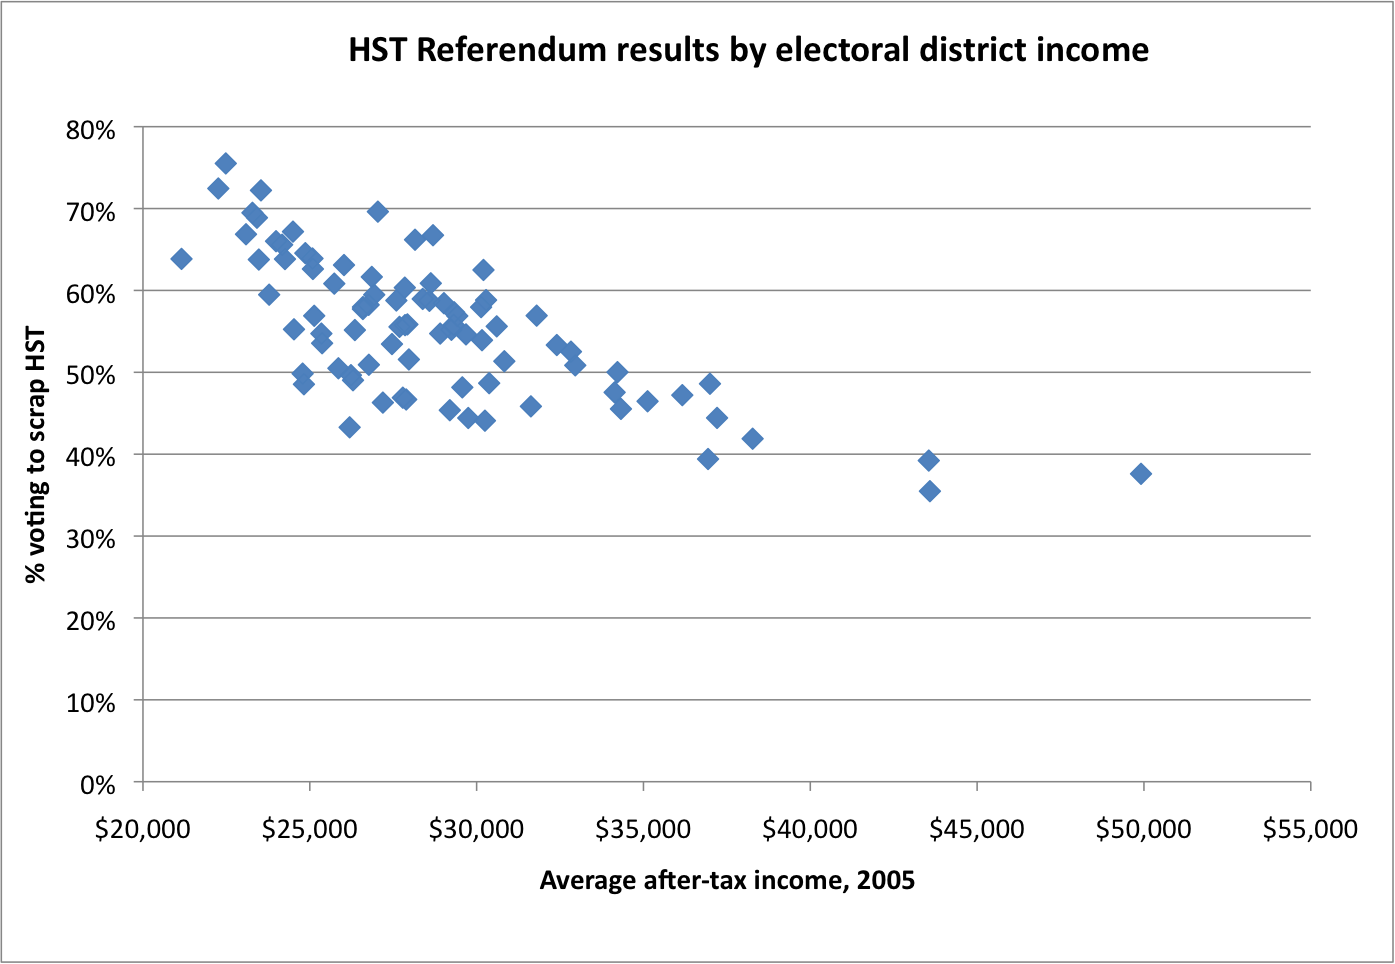
Was the vote was split along income lines?
Here’s what I found when I plotted the referendum results (% voting to scrap the HST) by average after-tax income in the electoral district from BC Stats. The latest income data by electoral district is somewhat dated – it’s based on the 2006 Census – but the results are pretty clear. The poorer the electoral district, the higher the voters’ opposition to HST. And vice versa, in richer electoral districts more people voted to keep the HST.
I doubt this is a coincidence. Income disparities have grown over the last decade and as our incomes diverge, so do the opportunities we have and our experiences. Social cohesion is threatened when it becomes harder and harder to think of ourselves as British Columbians, voting for the benefit of our province, and start identifying more closely with a particular social class.
A recent article by Pete McMartin in the Vancouver Sun illustrates these diverging experiences all too well:
… the efficiencies the HST promises are real…But I also think that the retention of the HST is a question of class, that business people and economists and the well-salaried members of the media can afford to view the HST as a concept rather than a real financial burden.
Is it going to stop a family earning six figures from eating out more often? No. Will that family quail at repairing a leaky roof, and the added thousands an HST will add to that repair? Again, no. That well-off family cannot only afford the more immediate costs of a leaky roof, it can afford to entertain the long-range promises the pro-HST position makes -that down the road, the efficiencies the HST provide will deliver more jobs to the economy and lower costs to the consumer.
Call me a skeptic: That promise I find hard to take on faith, given our record of growing income disparities in this country. As for those future benefits, even the independent panel’s review on the HST characterized its benefits as “modest”.
What do you make of the referendum results?


Jordan Brennan // Aug 27, 2011 at 5:21 am
Nice work, Iglika! The results are interesting, but what of households (or individuals) that make over $50,000? I don’t think of people who earn $50k as being upper-middle class or all that privileged. What are the $80k, $100k and $250k individuals/households saying about the HST?
Iglika Ivanova // Aug 30, 2011 at 4:39 pm
Perhaps I wasn’t clear enough in the text above, but I plotted the voting results in each electoral district against the district’s average income. So the x-axis shows average income in the electoral district, not individual family income. We don’t know how individual families voted, since it’s a secret ballot, but we have results by district.
The families I think were hurt the most by HST are those with incomes around and above the poverty line who didn’t qualify for the HST low income credit because their incomes are too high yet the HST would take a chunk out of their already low income.
The income threshold at which the HST credit ends is $36,500 for single parents with one child and seniors’ couples, and $48,000 for 2-parent 2-child families.
So I’d estimate that single parents and seniors with family income between $36,500 and $50,000 and 2-parent 2-child families with incomes between $48,000 and $60,000 were the hardest hit. For single individuals, this would be income between $25,750 and $40,000. I call these “modest” or “low-middle” income families because they’re not poor but they’re also not very well off.
Families with higher incomes also will pay more tax and not get any credit back, but they have the income to be able to absorb this without suffering a decline in quality of life.
I agree that $50k is not upper-middle income, but I’d call it middle income in a split with lower-middle, middle and upper-middle income as I tabulated it here http://www.policynote.ca/what-is-a-middle-class-income-these-days/.
While I am eager to compensate lower-middle income families for the extra burden of paying HST, I think the rest of us should be paying the tax (which would be just over 50% of families in BC).
ben // Aug 27, 2011 at 8:11 am
Seeing as my wife and I’ve been foregoing at least one meal a day since the HST went into effect so we have enough food to feed our kids, this isn’t surprising.
The idea that poor people are somehow unable to understand economics is a load of bull. We understand all too well, we live it everyday and poverty isn’t just some column of numbers to us.
It’s not that we don’t understand the HST, we just don’t care. Call that selfish, whatever, but BC still has the highest child poverty rate in Canada, so who’s being more selfish?
Kim Reid // Aug 27, 2011 at 9:21 am
Your scatter plot looks extremely interesting. Were you able to calculate a correlation coeficient and how many data points did you use? I am curious because it looks like a significant correlation to me.
Shannon Daub // Aug 30, 2011 at 3:07 pm
Kim, Ben & Jordan: sorry for the delay in getting your comments live on the blog, usually we get first-time posts up faster than that. If you comment again in future, they’ll show up right away automatically.
Darcy // Sep 1, 2011 at 4:05 pm
To me, the HST vote was more a matter of whether it is acceptable for politicians to lie and mislead the public. They were punished by the referendum results for their deceptions, not necessarily for whether the HST is sound tax policy.
I can see the benefits, but the manner in which the HST was imposed, and the net transfer of a $2 billion tax load to consumers from corporations was too much to swallow.
Had government been forthright with taxpayers, talked to them as equals about the need for tax changes (instead of the “we know what’s best for you” approach), and introduced a fair tax (say 10% applied to a wider variety of products and services), the referendum might never have happened.
It is clear to me that voters will no longer tolerate blatant deceptions, and that the principles of democracy are more important than any specific policy.
Trevor // Sep 24, 2011 at 4:26 pm
This is a little late but I have always found it strange that people even voted no. when you look at the results what you are actually looking at is
Yes I do not like being lied to
No I do not mind being lied to.
when 40% of people do not mind being lied too something is wrong.