Mobility pricing: What happened? What’s next?
The final report of the Mobility Pricing Independent Commission (MPIC) was delivered to the Mayors’ Council and TransLink Board on May 24. The report was officially received and then referred to staff for further research and public consultation as there are many outstanding questions not to mention political hurdles ahead. If you are unfamiliar with mobility pricing, you may want to start with a couple primers, here and here (and my full report on mobility pricing and fairness considerations is here).
Media coverage of the report included some big and scary headline numbers about the potential costs to drivers because of mobility pricing. This post digs into those numbers and what they might mean for how Metro Vancouver funds transportation and manages congestion in the future.
In reality, a full detailed proposal for the region is lacking in the 378-page MPIC report. It will be some time before a serious and detailed plan is drafted, which would then require support from the Mayors’ Council and legislative approval by the BC government. It will likely be five to 10 years before implementation of a congestion management system and the revenue source to support Metro Vancouver’s transportation network.
There are 2.5 million stories of how Vancouverites get around the city.
That makes sense because there are 2.5 million stories of how Vancouverites get around the city and it’s appropriate that work be done to ensure any proposed system will be both effective and fair. Challenges facing the region, however, are not going away. As more people move to our region, congestion will inevitably worsen and an increasing share of electric vehicles will cut into existing fuel tax revenues that support the transportation network.
This is precisely the right conversation for Metro Vancouver to be having, but it is not an easy one when gas is sitting at $1.60 per litre. Municipal elections are coming in October and I don’t think politicians are willing to get way out in front of this one. Moreover, the March 2018 financial deal between TransLink and the BC government means the previous urgency around mobility pricing—as a revenue source for the Mayors’ Plan—is no longer the case.
What’s in the MPIC report?
The MPIC report puts some parameters and numbers to mobility pricing options for the region. It offers 13 principles for moving ahead, based on public consultations, public opinion polling and technical analysis. Two broad options from the public consultations process—congestion point charges and multi-zone distance-based charges—are suggested as potential solutions that meet multiple transportation objectives.
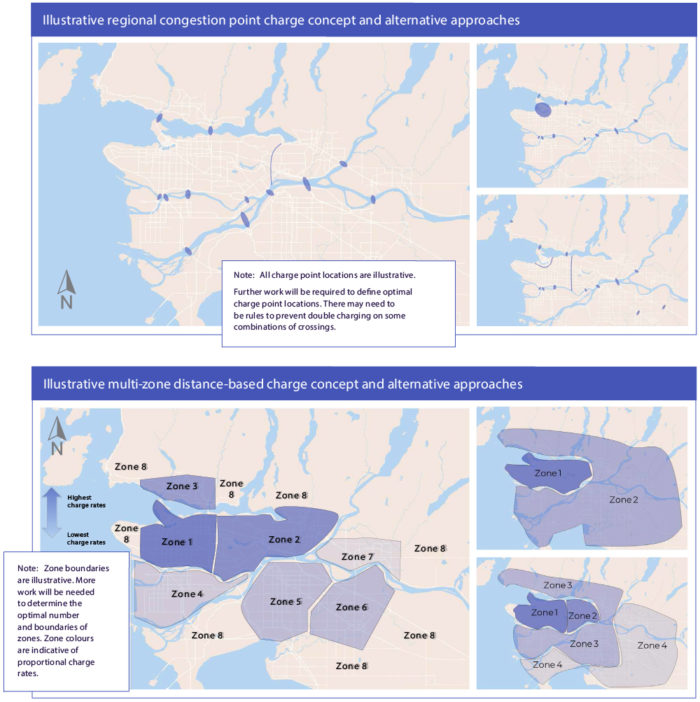
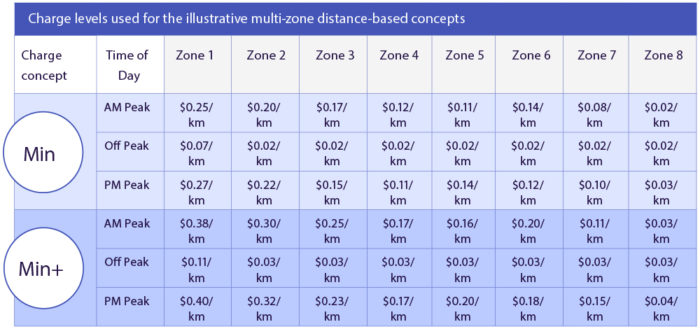
The figures below show what each concept might look like. Congestion point charges would likely entail tolling all regional bridges and some other congestion hotspots. Distance-based charges would be paid per kilometre driven but with different rates depending on where and when one was driving (higher rates in downtown Vancouver and also during peak hours).
Mobility Pricing Independent Commission
Within each option a number of details would remain to be determined: Are there exemptions for certain vehicles, such as commercial vehicles? Should there be exemptions for people with disabilities or people whose work requires a vehicle? Are there maximum charges by day, week or month? Do we charge people from out of town? How to compensate low-income households? Answers to these questions will have a great bearing on the fairness of outcomes.
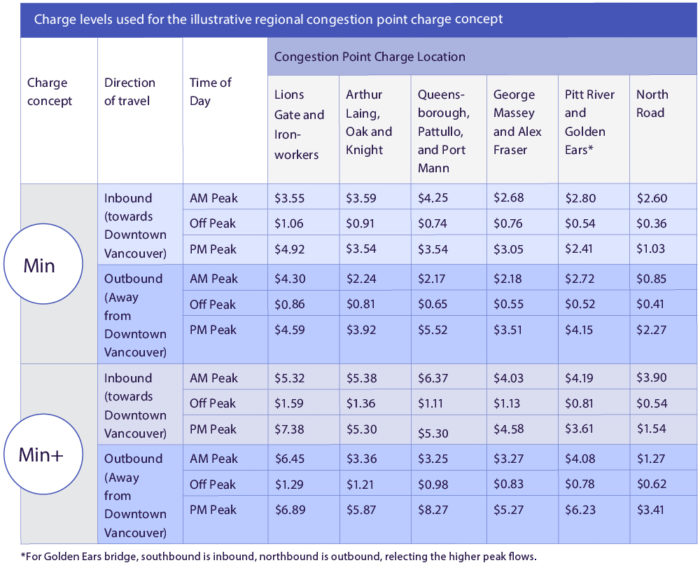
The most novel contribution in the MPIC report is a sophisticated transportation modelling exercise that considered numerous formulations of mobility pricing. It starts with estimates of the cost of congestion and then asks how high tolls/charges would need to be (in different locations and times of day) in order to reduce congestion to manageable levels—about a 20-25% decrease. For each alternative they cite a minimum congestion reduction (equal to half the total costs of congestion) and a more aggressive congestion reduction (equal to 75% of congestion costs).
As the figures below show, this leads to some rather high charges like $3.55 to cross the Lion’s Gate bridge at AM peak times and $4.92 at PM peak times ($5.32 and $6.89 respectively in the more aggressive conservation reduction case). For the distance-based charge examples they assume the elimination of the fuel tax, which works out to about 1.8 cents per km on average. Rates per km in this scenario could go up to 25 cents per km in the AM peak and 27 cents in the PM peak (38 and 40 cents respectively for the more aggressive conservation reduction scenario).
Mobility Pricing Independent Commission
Mobility Pricing Independent Commission
Faced with such rates many people can and would change their behaviour by carpooling, combining previously separate trips and shifting to off-peak times rather than pay the full peak-time price. Those who do pay would benefit from much faster and more reliable travel times.
Some caution is warranted in interpreting the headline dollar amounts cited in the mainstream media such as “up to $2,700 per household.” This is because of a tendency for reporters to cite the maximum possible amount that someone could pay—going the furthest distance at peak times—but that maximum is not what the vast majority would end up paying. The MPIC report cites median amounts of $5–8 per day for congestion point charges and $3–5 per day for distance-based charges. It’s also important to acknowledge that such households are already paying to travel in the region through regional fuel tax and a sales tax on parking.
The idea that driving on roads should not be free is contrary to how we have been taught to think about transportation. A better analogy is public transit: comparable transit fares are $1,500 per year for a two-zone transit pass and $2,000 for a three-zone pass.
Only after considering the mobility prices needed to alleviate congestion do the revenue estimates come into the picture. Each charging system would raise between $1 to 1.5 billion per year. That is a lot of revenue especially considering that the fuel tax currently brings in about $400 million annually.
What we do with mobility pricing revenues matters a great deal for fair outcomes. For example, the fuel tax could be eliminated, particularly with distance-based charges. I prefer keeping a higher cost on burning fossil fuels, but reducing fuel taxes could be seen as part of the political bargain for changing how we pay for transportation. Transit fares could be reduced (or even eliminated), and/or transit service expanded. Exemptions and caps would also lower revenues and could address many fairness concerns.
In particular, I have argued for some kind of mobility credit for low- to moderate-income households (similar to the carbon tax credit) that could be implemented to compensate those households. The MPIC report itself does a calculation of how much of the revenues would be needed to compensate low-income households: between $170 and 250 million for congestion point charges, and between $230 and 345 million for distance-based charges.
The MPIC report also estimates that the capital costs of the distance-based system ($400 to 700 million) would be more than double that of congestion point charges ($150 to 300 million), while operating costs would be $300–500 million and $110–200 million respectively. This is because congestion point charges are a mature technology and thus could be brought on stream sooner, while technology for distance-based charges is still in development (there are pilots in Oregon and Washington state).
Caution on the modelling
Full disclosure: I don’t have any experience with transportation planning models. But I’m wary that what comes out of any model reflects the data and assumptions that go in. A lengthy appendix in the MPIC report reviews the key assumptions in the modelling such as estimated population growth and car ownership. The modelling assumes the Mayors Plan goes ahead, but does not consider other factors that could swing outcomes one way or the other: amount of parking spaces per capita, addition of transit priority lanes, etc.
As an economist, I’m interested in the responsiveness of household behaviour to price changes (called “elasticity”), but it’s not clear to me what is driving the modelling here. One notable caveat is that the modelling does not allow any estimation of how people respond to mobility pricing by changing the time of day they travel, by combining trips that were previously separate and by avoiding certain trips altogether. Yet, these factors are a big part of how households would respond to mobility pricing. Instead, the model is more about how households get from point A to B in terms of route and mode choice.
Moreover, who knows what the future of transportation holds given the looming shifts toward ride-hailing and autonomous vehicles. In the face of such uncertainty, scenarios and/or a sensitivity analysis would be useful to test the implications of mobility pricing. This may need to be part of future work and research. The MPIC also relies on TransLink’s 2011 Trip Diary survey not the 2017 update that is presumably not yet ready for use.
**
In summary, the MPIC report takes a high-level concept and develops principles and a couple of broad frameworks for more detailed consideration. The technical side of the equation is the easiest part, while policy development to refine the concept and address fairness issues is still needed. Whether a full proposal can pass the test of public opinion and BC politics will be its biggest challenge.
Topics: Climate change & energy policy, Municipalities, Taxes