
Latest Statscan poverty numbers paint bleak picture for BC
Statistics Canada has released Incomes in Canada for 2011, with the latest poverty rates. You can find it here. And the numbers for BC are grim indeed, painting a very different picture from the rosy one the government likes to present.
First Call has put out a news release detailing some of the latest child poverty numbers, which you can find here. Media pick up on this story has been minimal to date, although The Tyee has a good piece here, and Daphne Bramham has an excellent piece in the Vancouver Sun here.
Based on Statscan’s Low-Income Cut-Off after tax (LICO-AT), BC once again has the highest child poverty rate (tied with Manitoba), and particularly disturbing, the rate actually increased in 2011 (rising from 10.5% in 2010 to 11.3% in 2011).
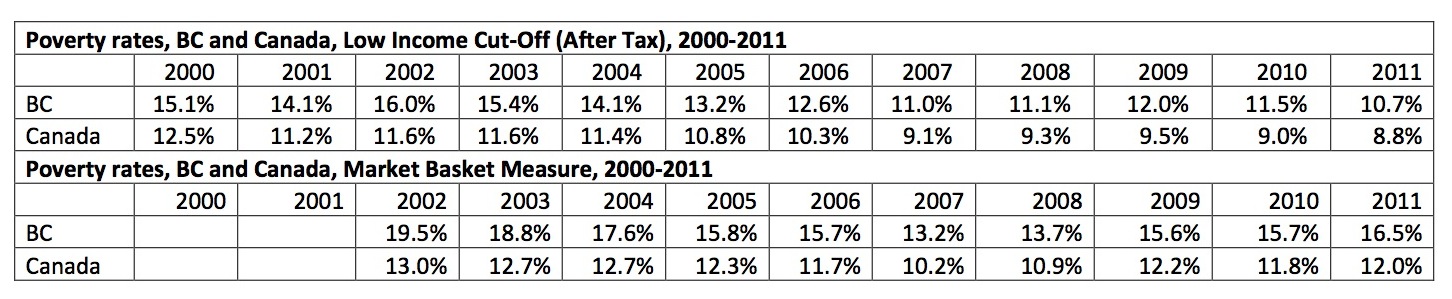
BC also continues to have the highest overall poverty rate in Canada. Based on the LICO-AT, BC’s overall poverty rate in 2011 was 10.7%, compared to a national average of 8.8%.

I’d also like to share some news about the Market Basket Measure (MBM), another poverty measure produced by Statscan and HRSDC. Happy to report on a small victory that policy-wonks among you may appreciate. As readers of the CCPA may recall, Steve Kerstetter, Michael Goldberg and I have had a multi-year argument with HRSDC, based on our belief that a few years back they messed up the methodology for calculating the MBM (rendering useless what used to be a very good poverty measure). Our critique can be found here. In short, HRSDC changed how they calculated the cost of shelter, producing ridiculous results for BC in particular.
Well, it seems after much cajoling, HRDSC finally reversed what they did (a posthumous victory led by Steve in particular, who sadly passed away two months ago). The MBM methodology has been corrected, the lines have been recalculated going back to 2002, and the new MBM rates are included in the recent Statscan release.
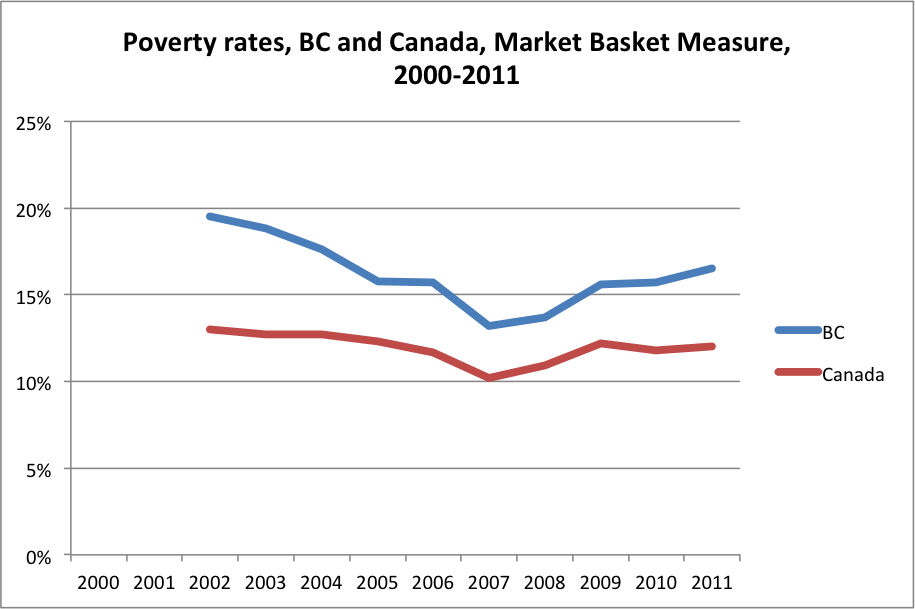
The bad news (although not unexpected), is that when using this corrected measure, BC’s poverty rate in 2011 is 16.5%, the highest in Canada, and well above the national average of 12% (indeed, BC’s rate is notably higher than in any other province), and the rate has been increasing since 2008 when the recession hit (see the chart and table below).
With respect to child poverty, with the new MBM revisions, they estimate that one in five BC kids is poor – 21.1% – compared to 13.7% for Canada as a whole. And this represents an increase in child poverty both nationally and in BC.
Happy to recommend people once again start using the MBM.
As for BC, we still need a poverty reduction plan.