Deep poverty: BC government can—and should—end it

The BC government’s public consultations into the development of a poverty reduction plan have ended.
Now the ideas and recommendations from hundreds of British Columbians are in the hands of the government as they turn all that input into the official plan. We’ve been told to expect enabling legislation—including legislated targets and timelines—for the fall session of the BC Legislature and a comprehensive plan by the end of 2018.
It’s great that the plan will include legislated targets and timelines. But what those targets and timelines will actually be remains to be seen. And based on engagements the CCPA and our coalition partners have had with the government to date, one area where it seems Ministry architects are reluctant to set targets is with respect to the depth of poverty. The depth of poverty refers to how far below the poverty line a person falls. The CCPA and the BC Poverty Reduction Coalition (PRC) have long called for a depth target to ensure that all British Columbians have an income of at least 75% of the poverty line within two years (of course the longer term target is to fully eliminate poverty, but this depth target is seen as an important short-term goal to quickly end profound hardship).
It’s no mystery why the government is resisting this call—it costs money. In particular, such a depth target would force the government to increase social assistance benefit rates. That’s because while the majority of the poor are not on social assistance, most of those in deep poverty are. As we have long noted, the breadth of poverty in BC (meaning the overall poverty rate) is primarily a low wage story, but deep poverty in our province is mainly a story of inadequate welfare rates.
To put this dynamic in numbers: while about 12% of British Columbians lived below the poverty line in 2016 (the last year for which we have data, based on the Market Basket Measure – MBM1), only about 4% of British Columbians relied on social assistance that year. About half the poor are either the “working poor” or their children, while the balance is mainly seniors relying on federal Old Age Security and the Guaranteed Income Supplement. Most of those who are working poor or poor seniors are already over the 75% of the poverty line threshold. Those who fall below this threshold are, in all likelihood, mostly on social assistance. Annual income for those on social assistance ranges from about 43% of the poverty line for people without children in the “expected to work” category to 68% of the poverty line for a single person on disability assistance to 71% of the poverty line for a single parent with one child. Notably, only parents with a disability manage to receive an annual income on assistance that modestly surpasses the 75% of the poverty line threshold, but of course families dealing with a disability face additional costs as well that are not captured by the MBM.
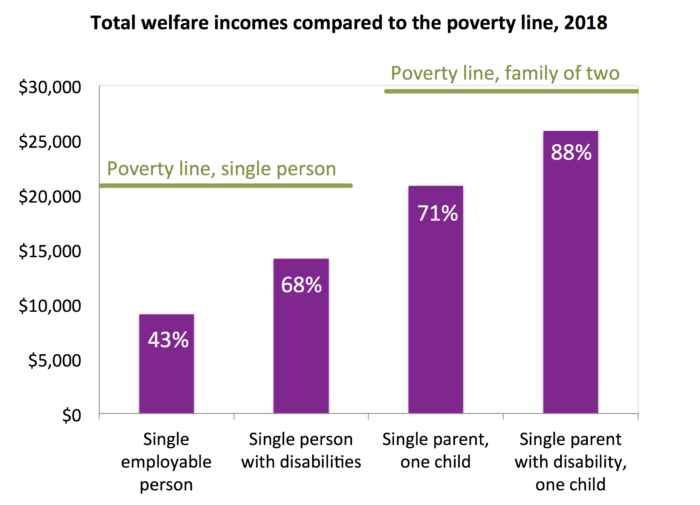
Note: The poverty line is based on the latest Statistics Canada’s Market Basket Measure data for Vancouver (2016) adjusted for inflation to 2018.
As the CCPA highlighted in our submission to the BC poverty reduction consultation process, it is essential that the government’s plan include the depth target noted above. We wrote:
“It is vital that the legislated targets tackle the depth and not merely the breadth of poverty. Meaning, we need targets that get all British Columbians out of deep poverty, as we also significantly reduce the overall poverty rate. The depth target long advocated by the PRC and ourselves has been to commit that: Within two years, every British Columbian has an income that reaches at least 75% of the poverty line. Targets aimed at eliminating the most extreme and severe forms of poverty—such as homelessness and hunger—are also necessary. Failure to include depth targets such as these in the BC plan risks leaving the poorest and most vulnerable behind, and would absolve the government of necessary action in the areas over which it has the most direct responsibility, namely social assistance and housing.”
But in discussions with the government to date, Ministry officials appear reluctant to adopt such targets. It seems they may not want the government’s hand forced, and specifically, may want to avoid targets that would effectively require a substantial boost in welfare benefit rates. At consultation meetings, officials have frequently claimed that the 75% depth target would cost in the realm of $4-5 billion a year and is thus prohibitively high.
However, even putting aside the reality that keeping people in poverty is itself costly,2 this Ministry cost estimate is puzzlingly large and distracting.
The cost of getting all British Columbians on social assistance to 75% of the poverty line would be approximately $365 million.
We’ve crunched the numbers (see Table) and find that the cost of getting all British Columbians on social assistance to 75% of the poverty line (based on the MBM) is dramatically less than $4-5 billion a year. And in recent engagements with government officials, we understand that the government’s estimates for meeting this more focused goal are nearly identical to ours. Specifically, the total cost of meeting this target would be approximately $365 million—an additional annual expenditure well within the government’s capacity (for context, this amounts to about 0.7% of the annual provincial budget).
For a single person in the Expected to Work category (those farthest away from the poverty line, and the second largest group of welfare recipients), closing an annual income gap of $6,581 a year to reach 75% of the poverty line would mean increasing monthly assistance by $548.
For a single Person With a Disability (PWD, the largest group of social assistance recipients whose income is currently closer to the poverty line), the annual income gap to reach 75% of the poverty line is $1,500, requiring a monthly income boost of $125. But if the government wanted to continue providing a higher level of assistance to those on PWD, in recognition of higher costs faced by people with disabilities, and given that those in the PWD category will often be there until retirement age and need to live in dignity throughout that time, the government can aim higher and bring these folks right up to the MBM poverty line. The annual income gap to achieve this goal is $6,708, requiring a monthly income boost of $560. The total annual budget to reach this laudable goal would be $602 million.
For single parent families (the third largest category of social assistance recipients), the annual income gap to reach 75% of the poverty line is $1,313, requiring a monthly income boost of about $110.
Notably, the total annual cost of getting all those currently on social assistance entirely to the MBM poverty line is approximately $1.16 billion. Of this amount, just over half would go to single people on disability assistance (those with PWD status), the largest single group of people receiving assistance.
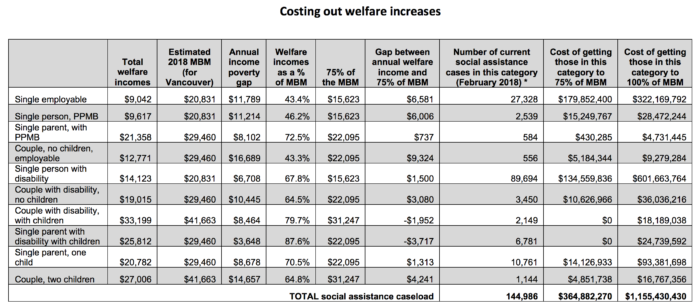
Source and notes: Authors’ calculations based on the methodology used in Caledon Institute’s Canada Social Report: Welfare in Canada, 2016, Table 4: Comparison of 2016 Welfare Incomes with Market Basket Measure (MBM), pp. 44–45. Annual welfare income includes applicable Canada Child Benefit income, BC Early Childhood Tax benefit, the federal GST credit, the BC low-income carbon tax credit, the BC sales tax credit and annual “Christmas” and back-to-school supplements for the calendar year 2018. Updated by authors to include additional welfare recipient categories and 2018 MBM estimates (assuming two years of 2% increases from Statistics Canada’s 2016 MBM numbers). Note that total welfare income is inexact as social assistance caseload stats do not provide breakdowns of family size with multiple children. * Welfare caseload stats do not break down families by the number of children. So this table assumes all single parent families have one child and all two-parent families have two children, and calculates annual family income on that basis. Thus the figures in this table are estimates of total cost. Also, these calculations assume no use of earnings exemptions (the welfare system allows people to earn and keep a modest amount of money—known as earnings exemptions—but only 10 to 21% of social assistance recipients claim any earnings exemptions; hence our decision to exclude this from our calculations).
Some may argue that substantially increasing social assistance benefit rates would mean more people drawn to assistance, thereby driving up the above cost estimates.
Perhaps a few more, but not many. Even with these increases, life on welfare in this expensive province is hard—it is not a life most people willingly choose. Of greater relevance, applying for social assistance and successfully gaining support is difficult—the rules and process are onerous, and in the absence of rule changes, it is unlikely there would be a significant increase in the welfare caseloads. Moreover, almost two-thirds of those on assistance are on disability assistance, and the processes for successfully attaining PWD status are even more onerous and often take years.
A false premise underlies the presumption that if government were to increase assistance, welfare would become too “attractive.” This notion is not supported by the evidence from recent experience. For example, prior to the 2017 boost to benefit rates, the last time there was a notable increase in basic welfare benefits was 2007 (when the rate for a single person went from $510 to $610 per month). But the Expected to Work caseload did not increase then or the year after. The caseload only went up modestly in the wake of the recession in 2009 (as is expected), and then came back down.
Similarly, there has been no notable increase in welfare caseloads since the new government’s $100 monthly increase to welfare rates last year; the February 2018 caseload was 144,986 compared to 144,058 a year earlier. The overall caseload rate has been relatively stable at about 4% of the population for many years.
The total annual cost of getting all those currently on social assistance to the poverty line is approximately $1.16 billion.
If some worry about increasing welfare benefit rates by “too much” (feeling it to be a hard-sell politically, or perhaps not wanting to narrow the gap between welfare and minimum wage income too much), then we would point out that there are in fact numerous policy vehicles—not only social assistance—for getting people’s incomes closer to the MBM threshold. For example, the provincial government could choose to rely in part upon the low-income carbon tax credit, another form of income transfer that goes to all low-income households in BC regardless of income source, age or family composition (this option would be more expensive as it would go to more people, but would also help to address the energy poverty challenges faced by all low-income households given rising BC Hydro rates and gas prices).3 Another option is for the provincial government to remove shelter support from social assistance entirely and provide a rental support allowance to all low-income people, whether on assistance or not, as Manitoba does.4 This could be a great boost to poverty reduction so long as stronger rent controls were also in place.
And of course the federal government could offer a helping hand. As noted below the table, the total annual welfare incomes calculated include federal contributions from the Canada Child Benefit and the GST credit. If the federal government boosted either or both of these amounts beyond inflation, the provincial cost of getting people closer to the poverty line would come down.
Any way one slices it, we can afford to end poverty in BC and we can most certainly eliminate deep poverty.
The BC government can and should budget in 2019 to get all British Columbians on welfare to at least 75% of the MBM poverty line.
Acknowledgements: The authors wish to thank Trish Garner, Michael Prince and Suzanne Smythe for reviewing a draft of this analysis. We also gratefully acknowledge the financial support of the Vancouver Foundation for the poverty reduction work we are currently engaged in.
Notes
- Statistics Canada produces three low-income measures. In this analysis, we use our preferred measure – the Market Basket Measure. The MBM is an absolute measure based on actual costs of a specified and modest basket of goods and services. A major advantage of the MBM is that, unlike any of the other measures, it captures differences in local costs of living (such as housing), which are particularly high in BC. We use the MBM for Metro Vancouver for this analysis, given that the majority of BC’s poor reside there. For more, see p. 11 of our 2017 report Long Overdue.
- See the CCPA’s analysis of the Cost of Poverty in BC.
- For more on “energy poverty”, see pp. 35-56 in Long Overdue.
- More on Manitoba’s Rent Assist program, which provides a rental support to all Manitobans linked to 75% of the median market rent.
Topics: Economy, Poverty, inequality & welfare